
When trading stocks, you’ll be faced with the choice between two primary strategies: fundamental analysis and technical analysis.
Technical analysis is the study of historical market data (mostly price and volume).
Technical analysts believe that a stock’s price reflects all relevant information – including fundamentals, news, etc.
They also believe stock prices tend to move in identifiable trends – looking for patterns such as “head and shoulders,” “cup and handle,” “wedges” and more.
If you focus on technical analysis, you’ll study price movements, chart patterns, trading volumes, and market trends to predict future price action. This is where stock charting software excels. It gives you the requisite tools like candlestick charts, moving averages, and technical indicators.
Fundamental analysis on the other hand seeks to uncover a stock’s true intrinsic value.
Instead of looking for patterns on charts, investors practicing fundamental analysis review a company’s financials, economic and industry factors, management factors and internal trading activity, and more.
If you practice fundamental analysis, your goal is to determine if a stock is undervalued or overvalued. Not to find patterns on charts.
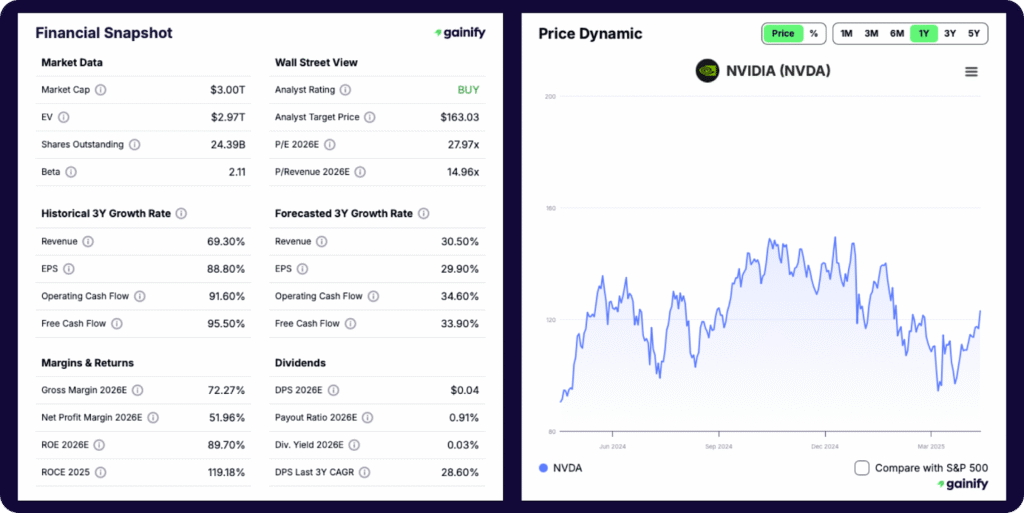
For this type of analysis, you’ll find specialized tools like Gainify.io are better suited, offering you deep insights into company financials, analyst estimates, AI-powered earnings analysis, and proprietary valuation metrics that help you understand a stock’s true worth.
While charting tools show you when to trade based on patterns, fundamental analysis platforms like Gainify help you identify what to trade by uncovering quality companies with sustainable competitive advantages and future growth potential.
Data Visualization Beyond Technical Charts: The Gainify Advantage
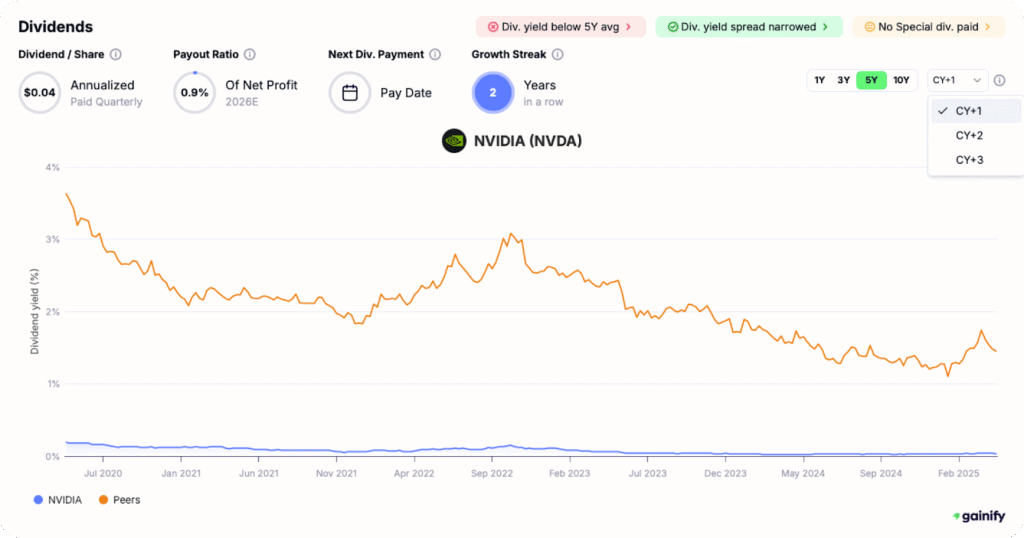
Technical charts focus solely on price movements. Successful investing, however, requires visualizing many other critical data points.
With Gainify.io you unlock access to comprehensive visual representations of fundamental data. Something traditional charting tools simply don’t offer.
Gainify’s top data visualizations and charts give you insights into:
- Analyst estimates: Track how Wall Street projections evolve over time with clear line charts showing estimate revisions.
- Peer comparisons: See how a stock’s valuation metrics like P/E, P/S, and EV/EBITDA compare visually against competitors.
- Proprietary Gainify rating: A composite visual scoring system breaking down a stock’s outlook, valuation, health, performance, and momentum.
- AI-generated insights: Visual alerts highlighting important context about insider transactions, earnings performance, and valuation trends.
These data visualizations complement your technical charting, helping you answer the crucial question: “Is this a quality company worth investing in for the long term?”
Now, let’s examine the top platforms for technical charting and when they’re most useful…
Finding Your Ideal Platform: Quick Guide
Before diving into detailed reviews, below you will find a quick reference for which platforms perform best in different areas.
Best for
- AI-enhanced fundamental analysis & visualization: Gainify.io
- Professional trading with integrated brokerage: Interactive Brokers TWS
- Advanced technical charting & social trading: TradingView
- AI-powered technical pattern recognition: TrendSpider
- Low-cost technical analysis: ProRealTime
- Options trading: Webull
- Futures trading: NinjaTrader
- Forex trading: Metatrader
Your ideal platform depends on your investment approach. Many serious investors use multiple platforms – for example, combining Gainify’s fundamental analysis tools with one of the technical charting platforms. This makes for a more comprehensive research workflow. One that enables you to invest confidently in quality companies.
1. TradingView: Social trading and advanced charting

TradingView leads the pack for most traders interested in technical analysis and advanced charting.
Technical capabilities include over 400 built-in indicators, customizable with Pine Script (the platform’s native programming language), and visualization tools.
You’ll find trading signals from technical indicators covering:
- Trend: The overall direction a stock’s price is moving over time. Visualized through trend lines and moving averages. This is typically classified as upward (bullish), downward (bearish), or sideways (consolidating).
- Momentum: The rate of acceleration (or deceleration) in a stock’s price movement helps you spot reversals or continuations. This is measured using indicators like RSI, MACD, and Stochastic oscillators.
- Volume: The number of shares traded in a given period. This gives you confirmation of price movements and trend strength. Higher volume typically validates price breakouts. Low volume, on the other hand, may signal weak moves or potential reversals.
- Volatility: Price fluctuation or uncertainty in a stock. It measures how dramatically prices swing up and down. You can track it using indicators like Bollinger Bands, Average True Range (ATR), and standard deviation.
What truly distinguishes TradingView from other stock charting software is its Pine Script programming language. With this proprietary scripting language you will be able to create fully customized indicators and strategies. The TradingView community has contributed over 150,000 custom scripts. Half of these are open to you as open-source code for modification.
TradingView’s comprehensive stock charting and custom Pine Script, combined with broker integrations for direct trading, make it a compelling option if you’re interested in day and swing trading.
But TradingView can be expensive – up to $499.95/month for the Ultimate professional tier.
The platform also falls significantly short if your focus is fundamental analysis and long-term investing. TradingView does not have the fundamental data, forward projections, and intrinsic valuation tools of Gainify.
Gainify’s complementary focus on AI-powered fundamental analysis, analyst verified estimates, and intrinsic valuation tools fill TradingView’s gaps – meaning you may benefit from using both platforms together for a comprehensive understanding and more confident investing.
Key Features
- Over 400 built-in indicators
- Multi-timeframe analysis and volume profiles
- Social community for sharing analysis and strategies
- Customizable with Pine Script programming language
- Integration with 60+ brokers for direct trading from charts
2. Interactive Brokers TWS: Pro Charting and Brokerage
Interactive Brokers TWS provides unmatched global market access across 160 markets in 36 countries.
But most importantly, you gain institutional-grade stock charting tools at retail investor-friendly prices. Instead of paying a monthly subscription fee, you’ll only pay fees on trades you actually make. All while having access to over 120 technical indicators and 90 trade types (from limit orders to algorithmic trading.)
However, you will find that getting set up on Interactive Brokers is difficult. The application process is complex, and requires a significant amount of your time.
The application requirements vary based on your account type and location. But if you’re based in the United States and applying for an individual account, you’ll need to provide:
- Social Security Number (or proof of ID for non-citizens)
- Current employer information (name, address, phone number)
- Bank account details for funding, including routing numbers
- Beneficiary information (name, address, and SSN)
Joint and IRA accounts require all the above for each account holder. Trust accounts demand you provide substantially more documentation, including:
- Trust certification forms
- Proof of identity for all trustees
- Trust establishment documents
- Information for up to five settlors/grantors
It could take you several hours to compile all this information and send your application. If you’re a serious trader who needs access to global markets and advanced charting tools, this might be worth the effort.
This, combined with the complexity and steep learning curve of the platform, means Interactive Brokers may not be the best platform for you, unless your main source of income and the majority of your time is dedicated to trading.
Key Features
- Low margin rates for trades
- Global reach with 160 markets across 36 countries
- Multiple asset classes (crypto, stocks, ETFs, bonds, etc.)
- Free courses and getting started lessons via IBKR Campus
3. ProRealTime: Low Cost Technical Analysis
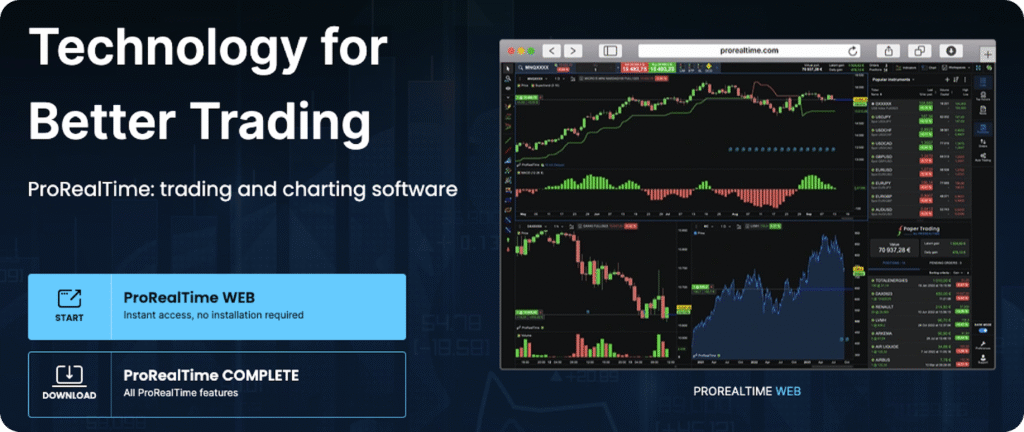
ProRealTime gives you a technical analysis toolkit with over 100 customizable indicators.
To speed up your stock research, you can set up customized screeners based on price, indicators, market trends, timeframes, and more.
The web platform is completely free (without ads, unlike some platforms such as TradingView.) The desktop app will cost you up to $84/month and provide you access to ProRealTime’s most advanced charting features.
All accounts (free and paid) give you paper trading capabilities so you can test your trading strategies.
Paid plans enable you to trade via a range of brokers. However, brokerage comes with minimum account limits ranging from €1,000 for IG to €3,000 for InteractiveBrokers.
If trading a range of markets fits your investment strategy, you’ll be pleased with ProRealTime. The platforms gives access to:
However, to access major exchanges in real-time, you’ll need to pay additional monthly fees. These include:
- US Markets: NASDAQ and NYSE from $6/month each.
- European Markets: London Stock Exchange and German Equities (XETRA) from $11/month each. Euronext and Italian/Spanish stocks from $6/month each.
- Futures & Options: CME Futures, NYMEX (Oil), and COMEX (Gold/Silver) from $6/month. EUREX (European) from $3/month.
If you want to access major US and European markets with futures and news, you could easily pay $201+ per month.
Key Features
- Comprehensive backtesting
- Advanced charting and drawing tools
- Direct trading integration with major brokers
- Built-in technical indicators with automatic pattern recognition
4. TrendSpider: AI-Powered Technical Analysis

With TrendSpider, you’ll unlock access to 220+ pre-made indicators out-the-box upon signing up. Whether you rely on moving averages, bollinger bands, relative strength, or any other major indicator – you’ll have everything you need to fuel your stock analysis.
If you’re more technical, you can also create your own custom indicators using JavaScript.
TrendSpider’s unique strength is in its proprietary AI tools designed to reduce how much time you spend analyzing stocks. With them, you can:
- Generate trading strategies from natural language descriptions
- Execute trades automatically through connections with 24+ brokers
- Automatically detect chart patterns like trend lines and Fibonacci levels
If you feel like technical analysis alone doesn’t give you the confidence you need when trading – TrendSpider provides strong fundamental data.
You’ll be able to compare technical analysis insights to signals buried in a stock’s fundamentals such as EPS, EBITDA, forward P/E and P/E ratio, revenue trends, and more.
You can even use Wall Street analyst estimates like a technical indicator, correlating individual analyst’s estimates with actual price action. By doing so, you can find which analysts get it right (or wrong) which may help you decide who to listen to.
One of TrendSpider’s most interesting charts is not a price chart, but its options flow visualization. With it, you can spot large volumes of options trades, which may serve as a trading signal.
All in all, TrendSpider is a well-rounded stock research platform with both technical and fundamental analysis features to rival the best.
However, this level of feature access will cost you. TrendSpider plans require an investment of up to $199/month for individual plans, and up to $349/month for business plans.
Key Features
- Backtest strategies
- AI powered automation
- Top investor & Congress member trade tracking
- Comprehensive data history and packet of technical indicators
- Raindrop charts that combine volume and price data into a single visual
- AI strategy lab to build trading models using machine learning (K-NN, logistic regression, random forest)
5. Webull: Options Trading Powerhouse
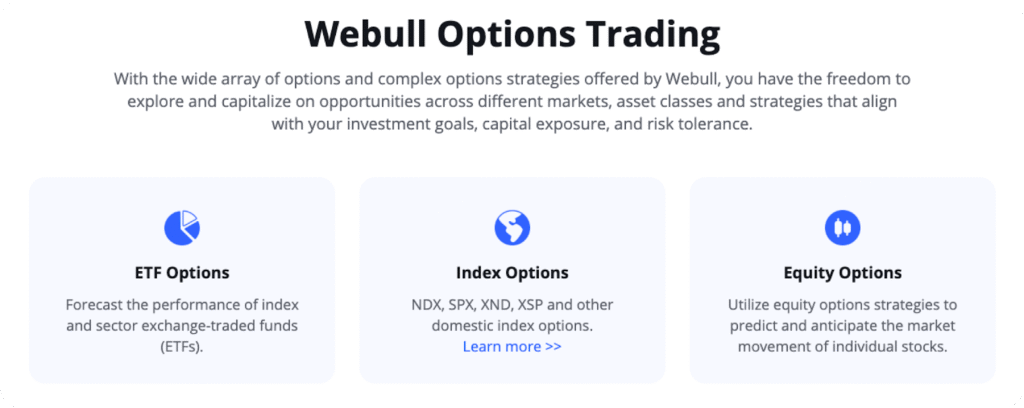
Research ETF, equity, and index options. Create multi-legged combination orders or utilize pre-built common strategies such as straddles, strangles, and butterflies.
Webull has a comprehensive suite of features to power your options trading:
- TurboTrader widget: View market depth and execute orders from a single interface
- Greeks analysis: Access detailed options pricing metrics including delta, theta, and implied volatility
- Probability analysis: Assess potential outcomes for various market scenarios
You can also practice strategies risk-free using paper trading. If you’re new to options and want to test strategies before committing real capital, Webull is a great platform to get started with.
Webull organizes options trading into four permission levels, so you can use increasingly complex strategies as you gain more experience.
- Level 1) Basic strategies (covered calls, cash-secured puts)
- Level 2) Long options and defined-risk strategies
- Level 3) Spreads and multi-leg strategies
- Level 4) Advanced strategies including naked options
Key Features
- Commission-free options trading
- Risk-free paper trading environment
- Low fees on index options ($0.55/contract)
- TurboTrader widget with market depth visualization
6. Metatrader: Forex Trading Specialist
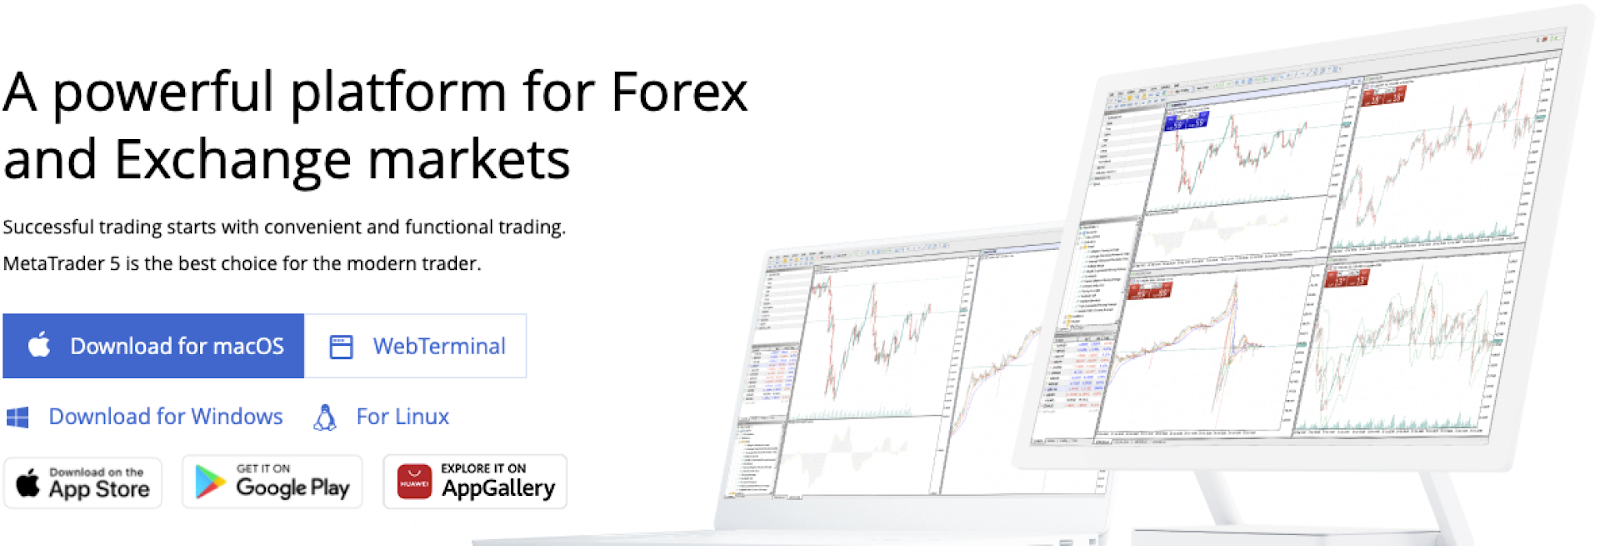
If you’re after sophisticated Forex tools, Metatrader won’t disappoint. While the interface is clunky and leaves a lot to be desired compared to the more modern UX of many stock charting platforms available today, it is packed full of features.
Subscribe to signals of successful investors to copy their trades, or conduct your own fundamental and technical analysis to find Forex opportunities.
Metatrader’s standout Forex features include:
- Optimize complex strategies across correlated pairs with multi-currency backtesting
- Hold multiple positions on the same currency pair
- 21 timeframes from 1-minute to monthly charts
- Comprehensive fundamental analysis tools
- 38 built-in technical indicators
Whether you’re day trading major pairs or implementing long-term strategies, Metatrader’s tools will help you uncover top opportunities.
Key Features
- Dual position systems – hedging and netting for any Forex strategy
- Built-in economic calendar and real-time news feed
- Multiple stop orders and take profit levels
- Customizable trailing stops
- 6 pending order types
7. NinjaTrader: Futures Markets Coverage
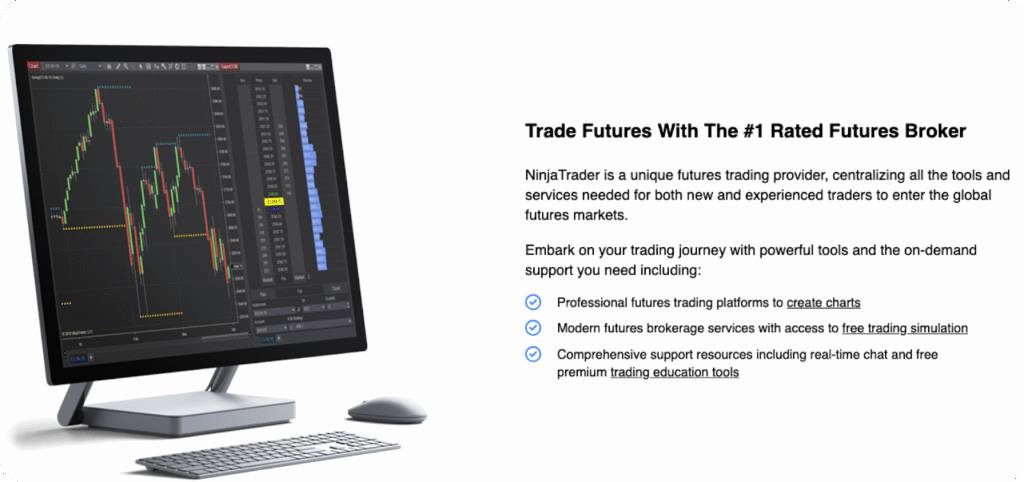
Trade index, energy, crypto, metal, and treasury futures. NinjaTrader platform comes complete with paper trading so you can practice your strategies before placing real trades.
With Micro E-mini futures trading available, you can trade at just 1/10th the size of standard E-mini contracts. As a result, you get access to S&P 500, Nasdaq-100, Russell 2000, and Dow Jones Industrial Average at substantially reduced costs.
Excitingly, you can also trade Bitcoin and Ether futures contracts – perfect for unique access to crypto markets in a traditional Futures trading platform.
If Warren Buffet’s huge holdings in U.S. treasury bonds has piqued your interest, you’ll be able to trade four maturities of Treasury bonds and notes futures contracts (2-year, 5-year, 10-year, and 30-year.)
Key Features
- Extensive learning resources
- Unlimited simulated trading
- Desktop, web, and mobile versions
- Low $50 margin requirements for micro contracts
Complementing Charting with Fundamental Analysis
Technical analysis through stock charting software can definitely be useful for your stock research process. Price movements and momentum are key insights you don’t want to miss.
But the most successful investors (for example, Warren Buffett, Charlie Munger, Seth Klarman, Joel Greenblatt, and Bill Ackman) understand that uncovering a stock’s true intrinsic value demands comprehensive fundamental analysis.
This is where platforms like Gainify.io excel, giving you a vital perspective that complements your technical charting tools.
Why Gainify.io Enhances Your Trading Strategy
- Advanced data visualizations: Powerful visual representations of fundamental data with intuitive bar charts, line graphs, and other visualizations. Makes complex financial data easy to understand at a glance.
- Contextual AI chart insights: Gain immediate insights with notifications highlighting important trends and provide context right on the charts – from insider selling patterns to valuation metrics being above or below 5-year averages.
- AI-powered research: Gainify AI is connected to real-time Wall Street data, enabling you to ask deep research questions, summarize earnings calls, and create competitor comparisons.
- Analyst estimates database: The world’s largest database of analyst estimates with historical tracking and forward projections.
- Proprietary metrics: Unique valuation indicators that help identify future value potential beyond what charts can show.
- Top investor tracking: Monitor what successful investors are buying and selling.
Add Gainify to your stock research process to validate technical breakouts, find quality companies before technical patterns emerge, make more confident long-term investment decisions, and avoid value traps that look to be attractive investments based on charts but lack fundamentals.
Making Your Final Decision
When choosing stock charting software you must first identify your requirements. One stock charting or research app may be suitable for most traders, but not for you.
First is which asset types you plan to trade. Many stock research apps provide access to stocks only. If you want to trade options, futures, forex or crypto – you need to first filter for platforms based on asset types included.
Next, you need to ensure the platform covers the specific regions you intend to invest across. Most platforms today offer global data. Unless you have a truly niche need, you shouldn’t have much trouble here.
Once you’ve done that, ask yourself:
- What is your budget?
- Which essential features are must-haves, which can you live without?
- What is your experience level? (if you’re just starting out, the steep learning curves of some platforms will keep you out of the market while you learn the ins and outs)
- Do you need brokerage integrations for direct trading? (some of the best stock research platforms actually don’t offer this)
Additionally, remember that one tool may not cover all your needs. It’s not uncommon to combine multiple tools into your stock analysis process. One of the best ways to do this is to combine your technical analysis tool with a platform providing detailed fundamental analysis capabilities.
A multi-strategy approach helps you identify not just when to buy or sell, but what truly deserves a place in your portfolio.
FAQs About Stock Charting Software
What is the best free stock charting software?
TradingView offers the best free charting option with basic features, though serious traders will benefit from paid tiers. For comprehensive analysis, combine free charting tools with fundamental analysis platforms.
Which charting software do professional traders use?
Professional traders often use Interactive Brokers TWS or specialized platforms like ProRealTime for their advanced features and institutional-quality data feeds.
Do I need both charting software and fundamental analysis tools?
Yes, the most successful traders combine technical analysis from charting software with fundamental research. While charts show price patterns, fundamental analysis reveals the underlying business quality and intrinsic value.
Can I trade directly from charting software?
Many platforms like TradingView, Interactive Brokers TWS, and Thinkorswim offer direct trading integration with various brokers.
How important is real-time data for charting?
Real-time data is crucial for day traders and active traders. Swing traders and long-term investors can often work with slightly delayed data, especially when complementing their analysis with fundamental research.