Stock analysis is the disciplined process of converting raw financial data into a coherent thesis on a security’s intrinsic value. This methodology is traditionally divided into two primary schools of thought: fundamental analysis, which looks at a company’s commercial viability and its capacity for sustained cash flow growth, and technical analysis, which interprets price action and volume to forecast future momentum.
Today, stock analysis increasingly relies on the best stock analysis tools, which consolidate financial statements, analyst estimates, earnings transcripts, and market data into a single research environment. These platforms allow investors to screen companies, compare peers, and visualize key financial trends, transforming large datasets into actionable insights and significantly improving research efficiency.
By applying a rigorous analytical framework supported by the right stock analysis tools, investors move beyond speculation and surface-level signals. This structured approach makes it possible to identify businesses with durable economics and the potential to compound value over time.
The real challenge, however, is execution. Most investors struggle to find a single workspace that brings fragmented financial data together and turns it into clear analysis. Manually reviewing thousands of filings, financial metrics, and macro signals is no longer realistic for an individual. Choosing a platform that consolidates this information and translates it into actionable insights has therefore become one of the most important decisions in building a disciplined investment process.
In this guide, we provide a definitive review of the top research platforms available in 2026, covering both free and paid options. We analyzed best stock market analysis tools such as Gainify, Yahoo Finance, Simply Wall St, TIKR, Fiscal.ai, Koyfin, Finviz, Alpha Spread, Magnifi, TradingView, TrendSpider, and Stock Analysis. I tested and ranked each platform based on how well they bridge the gap between raw data and professional level clarity. Whether you need a free stock analysis app for general tracking or institutional grade software for complex valuation modeling, these evaluations will help you navigate the market with confidence.
What Makes the Best Stock Analysis Tool in 2026
The real divide between retail and institutional investing isn’t just about who sees the numbers first. While basic data is everywhere, the challenge is finding a single workspace that pulls verified, high-quality information into one view. Most individual investors are still stuck jumping between a dozen tabs to find what a professional can see on a single screen.
To succeed in this market, you need to analyze stocks before investing by using stock analysis apps that focus on synthesis rather than just listing facts. When evaluating the platforms in this guide, we looked for a few specific evolutions that separate a high-quality toolkit from a basic app.
- Verified institutional data: Many free apps rely on low-cost or delayed feeds that are often riddled with errors. We prioritized platforms that bridge this gap by providing the same verified data used by professionals, such as S&P Global. This ensures you aren’t basing your entire investment thesis on inaccurate or incomplete numbers.
- Interlinked AI workflows: The real shift in 2026 is how AI is baked into the actual research process. The best stock analysis software doesn’t just have a chatbot on the side. They offer a workflow where your screener, financial models, and news feed all talk to each other to highlight risks and opportunities automatically.
- Automated context and filtering: Older tools give you a wall of numbers and expect you to do all the homework. Modern platforms use AI to scan thousands of pages of filings and earnings calls for you. They pull out the actual drivers behind a price move so you can skip the manual digging and focus on the “why.”
- Deep personalization and customization: A one-size-fits-all dashboard is no longer enough. The best stock market analysis now allow you to build custom views for your specific portfolio and visualize any data point you want. This means you can create your own financial charts for things like cash flow growth or margin trends, overlaying them against price action to see the full story.
- Consolidated intelligence: Professional traders don’t jump between a dozen browser tabs. We looked for stock analysis tools that pull fragmented pieces like financials, real-time news, and forward-looking analyst estimates into a single view. This mimics a professional terminal experience without the five-figure price tag.
- Predictive depth: While most apps are obsessed with what happened yesterday, the stock research tools that actually help you compete provide deep estimates for the future. This includes granular projections for every major financial metric.
Ultimately, a tool is only as good as the clarity it provides. In a market where every second counts, having a platform that can sift through the noise to find what is truly relevant is the difference between a winning trade and a costly mistake. The goal is to move away from manually hunting for data and toward a workflow where the data works for you.
Types of Stock Analysis Tools
To choose the right toolkit, you have to understand how different platforms approach the market. While the lines are blurring in 2026, most tools fall into a few specific categories based on how they process data and help you find an edge.
A well-rounded strategy usually involves combining these functions or finding a single platform that integrates them all. For those new to the space, having fundamental analysis explained is essential for understanding how to use these stock analysis apps to calculate a company’s true worth.
- AI Native investment platforms: This represents a total departure from traditional research, where intelligence is built into every core element. Every step of the workflow is natively AI powered, from screeners that understand qualitative context to automated transcript synthesis and intrinsic value calculators that model complex growth scenarios instantly.
- Fundamental terminals: Built for deep dives, these platforms are the heavy hitters of data. They provide decades of historical financials and forward looking analyst estimates, allowing you to model a company’s future value with professional precision.
- Charting and technical platforms: These focus entirely on price action and market psychology. They are designed for investors who want to visualize trends and use technical metrics, such as moving averages and volume profiles, to identify the most opportune entry and exit points for a position.
- Dynamic portfolio trackers: Beyond finding new ideas, these tools help you monitor what you already own. They provide a high level view of your holdings and often include automated risk analysis to show you exactly how your portfolio is positioned against the broader market.
- Niche utility tools: These players focus on doing one specific task exceptionally well rather than providing a full suite. These include specialized earnings calendars, real time news squawks, or standalone screeners designed for high speed data filtering without the broader research context.
The best stock analysis apps in 2026 have moved beyond simply displaying data to actually synthesizing it. Instead of forcing you to jump between five different apps, the top platforms now unify these categories into a single, cohesive workflow. Leading this evolution is our top ranked platform, which has democratized the kind of deep intelligence once reserved for institutional desks.
Best Stock Analysis and Research Tools
In 2026, the real advantage belongs to the investor who can turn a mountain of noise into a single, coherent strategy. As we discussed, the challenge is no longer finding a ticker or a price, but surviving the flood of fragmented data that pours in from every corner of the web. The following tools represent the best efforts to solve this problem by providing the unified workspaces and verified data required to move from speculative guesswork to a disciplined investment thesis.
The following table I compare the top 12 providers based on their architectural approach and the specific investment edge they provide.
2026 Tool Comparison Table
Platform | Category | Best For | Core Advantage |
|---|---|---|---|
Gainify | AI-native research platform | Full-cycle stock research | One of the most comprehensive research platforms, combining AI analysis, screening, valuation, alerts, and portfolio monitoring with a very strong functionality-to-cost ratio |
Yahoo Finance | Market monitoring platform | News and daily market tracking | Broad free market coverage with strong news aggregation and community discussion |
Simply Wall St | Visual fundamentals platform | Quick company overviews | Snowflake-based visual summaries that simplify company fundamentals |
TIKR | Financial terminal | Deep fundamental analysis | Institutional-style financial datasets and analyst estimates sourced from S&P Global |
Fiscal.ai | KPI and data platform | Operational business analysis | Segment-level data, KPI coverage, and custom formula-based analysis |
Koyfin | Multi-asset research terminal | Macro plus cross-asset analysis | Custom dashboards combining equities, macro data, fixed income, and charting |
Finviz | Stock screener | Fast stock discovery | High-speed screening, market heatmaps, and technical filtering |
Alpha Spread | Valuation platform | Intrinsic value investing | Built-in DCF models, relative valuation tools, and value-oriented stock ideas |
Magnifi | AI portfolio platform | Portfolio guidance | AI-assisted portfolio analysis with Plaid-based account aggregation and trading |
TradingView | Charting platform | Technical trading | Market-leading charting, alerts, and community-driven technical analysis |
TrendSpider | Automated charting platform | Pattern-based technical trading | Automated pattern recognition, trendline detection, and trader-focused alerts |
StockAnalysis | Financial data platform | Raw company financials | Extensive financial history, broad stock coverage, and easy spreadsheet exports |
Gainify.io
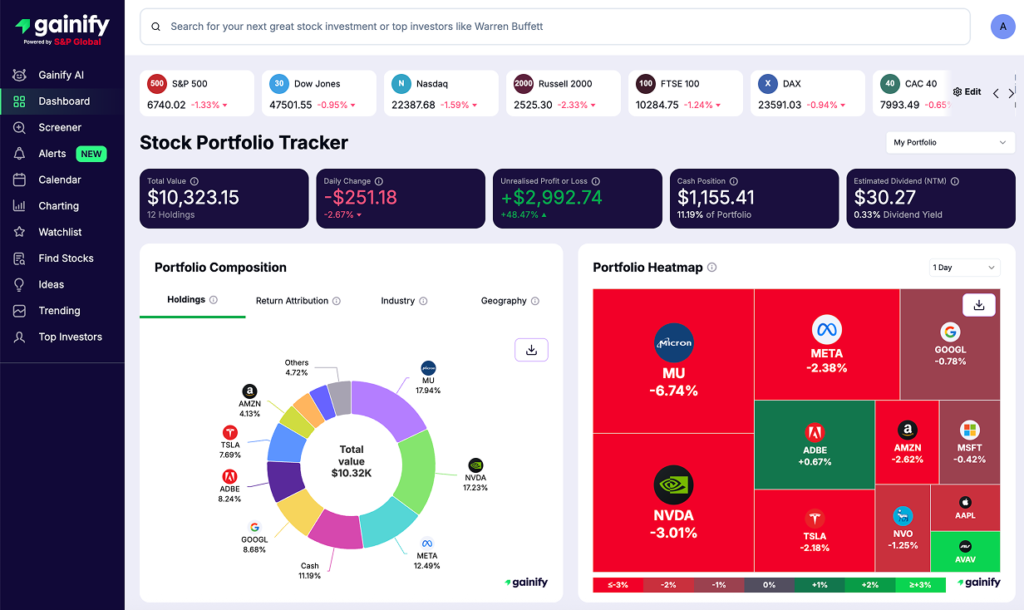
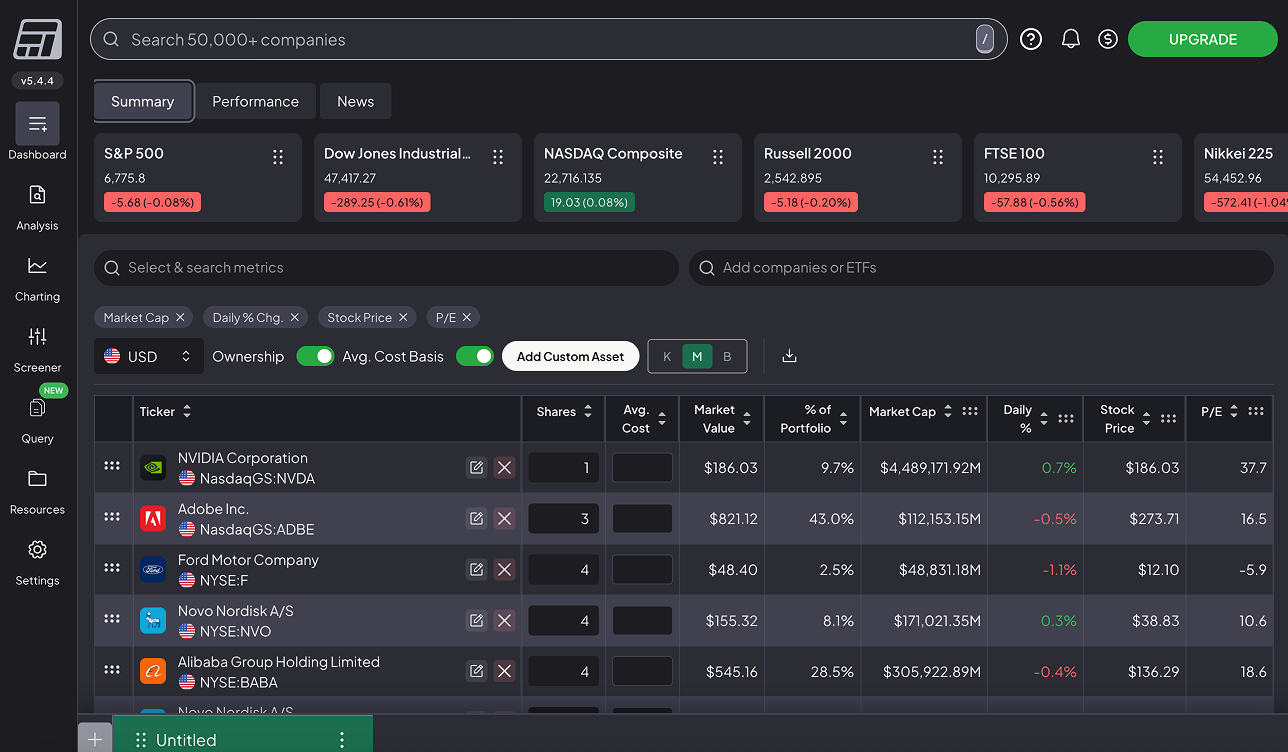
I tested Gainify extensively while reviewing the best stock analysis sofware, and the platform is clearly built around one central idea: the portfolio sits at the center of the entire research workflow. Instead of treating screening, company analysis, charting, and alerts as separate tasks, Gainify connects these steps around the investor’s actual holdings. In practice, this means a stock discovered through screening can move directly into deeper analysis, valuation checks, alerts, and portfolio monitoring without forcing you to repeat the same work across multiple tools.
The surrounding ecosystem is built to support that workflow. Gainify includes an AI-assisted research layer, automated alerts, an intrinsic valuation model, and one of the most capable stock screeners available to retail investors. The screener provides access to more than 1,000 financial metrics, allowing investors to filter companies by revenue and earnings growth, operating margins, return on capital, leverage levels, valuation multiples, and analyst estimate revisions across global markets.
Another highlight is the chart builder. Investors can visualize financial metrics such as revenue growth, margins, or valuation multiples alongside stock price to better understand what is driving performance. Charts can also be edited and exported into multiple formats, making it easy to reuse them in presentations, research notes, or deeper financial analysis outside the platform. Together, these tools create a workflow where investors can move naturally from idea discovery to valuation and finally to portfolio decisions.
Main features
Gainify is designed as a unified research environment where the different stages of stock analysis naturally connect. Instead of treating screening, company research, charting, and monitoring as separate tools, the platform links them into a single workflow. In practice, an idea discovered through the screener can immediately move into deeper analysis, custom charts, valuation alerts, and watchlist tracking without switching between multiple platforms.
Main features
Feature | Description |
|---|---|
AI research engine | The AI stock analysis tool helps analyze financial data quickly. Investors can ask questions about companies, summarize earnings calls, review financial statements, and compare competitors without manually reading long filings. |
Stock screener | The free stock screener covers 150+ global exchanges and includes 1,000+ financial metrics. Investors can filter companies by valuation, growth, profitability, and analyst estimates. |
Valuation alerts | Alerts can be set based on price action, valuation multiples or analyst estimate revisions, helping investors track when a stock reaches predefined entry or exit levels. |
Chart builder | The chart builder links price performance with company fundamentals. Investors can overlay metrics such as revenue growth or margins and export charts in multiple formats for external analysis or social media postin. |
Stock watchlists | Companies discovered during research can be saved to a fully customizable stock watchlist. Investors can create separate watchlists for different investment themes, sectors, or strategies while tracking valuation changes, analyst view revisions, and key financial updates in one place. |
Global coverage | Gainify provides data on 85,000+ companies across 95+ countries, allowing investors to screen and analyze global markets. |
Pros
Gainify offers one of the most comprehensive ecosystems of stock research tools, with the portfolio placed at the center of the entire workflow. Screening, company analysis, charting, and monitoring are connected around actual holdings rather than functioning as separate tools.
✅ Institutional-grade financial data from S&P Global Market Intelligence
✅ Forward analyst estimates with long-term valuation and financial history
✅ Global stock coverage across more than 150 exchanges worldwide
✅ Powerful stock screener with over 1,000 financial metrics
✅ Clean chart builder linking performance with company fundamentals
✅ Integrated alerts supporting disciplined portfolio monitoring
Overall, the platform combines institutional-quality data, powerful screening and visualization tools, and portfolio-centric monitoring into a single research environment designed for disciplined investors.
Cons
While Gainify provides a broad and well-integrated research environment, a few limitations are worth considering depending on an investor’s workflow.
⚠️ The depth of tools & metrics may require time for new users to navigate.
⚠️ Trades cannot be executed directly from the platform.
⚠️ Investors focused purely on technical analysis may prefer dedicated charting platforms.
⚠️ Some advanced datasets and higher AI limits are only on paid plans.
⚠️ No dedicated mobile app, the platform is primarily web-based.
The platform prioritizes deep fundamental research and portfolio oversight rather than short-term trading tools, making it better suited for investors focused on long-term analysis.
Pricing
Gainify offers a flexible tiered structure that scales with how much research you need to do, with no credit card required to start.
- Starter (Free): Includes the full stock screener, portfolio tracker, and 10 AI queries per month with 1 year of forward estimates.
- Investor ($9.92/mo billed yearly): This is the best value plan, unlocking 50 AI queries, 3 years of forward estimates, and the full suite of trade alerts and ratings.
- Gainer Pro ($26.99/mo billed yearly): Designed for active professionals, this tier offers 500 AI queries per month and the maximum 15 years of historical financial data.
The platform offers a strong price-to-capability ratio, delivering institutional-grade research tools at a fraction of the cost of traditional financial terminals.
Best for
Gainify is best suited for investors who want institutional-grade research tools without the cost of professional terminals. The platform is particularly useful for those who prefer to run their entire research process in one place, from idea generation to portfolio monitoring.
Instead of switching between multiple stock analysis apps, investors can move seamlessly from screening companies to analyzing fundamentals, visualizing financial trends, and tracking positions within a single integrated workflow supported by verified financial data and AI-assisted insights. As a result, Gainify stands out as one of the best stock research tools for investors who want a complete research environment rather than a collection of separate apps.
Yahoo Finance
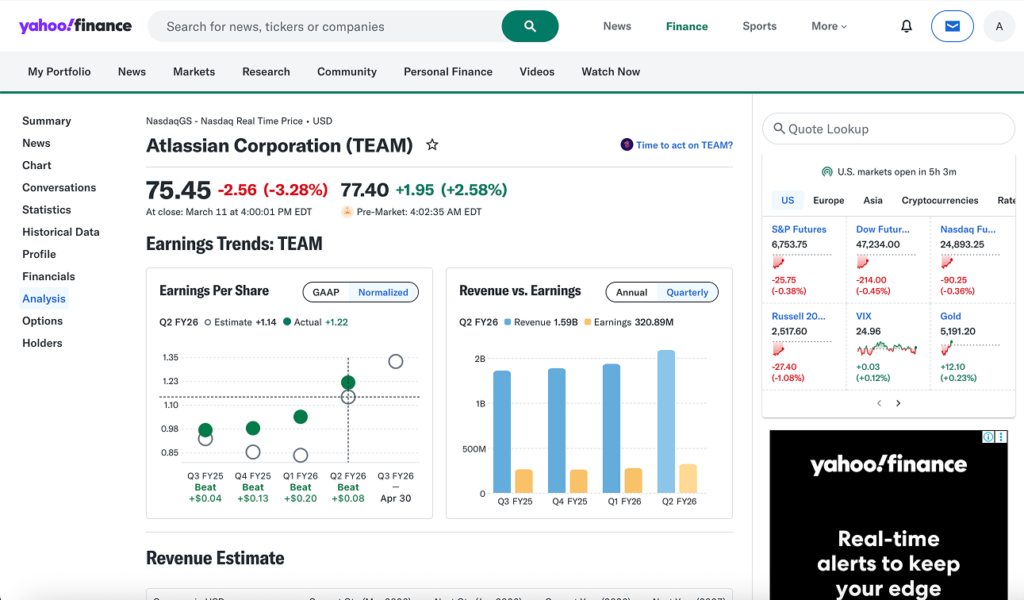
I tested Yahoo Finance alongside other stock analysis tools, and it remains one of the most widely used platforms for basic market tracking and news monitoring. The platform is built primarily around real-time market information, financial news, and price charts rather than deep fundamental research. For many investors, it serves as the starting point for following markets and monitoring stock prices.
The biggest strength of Yahoo Finance is its news-centric ecosystem. Company pages combine price charts, headlines, earnings updates, and a very active community discussion section where users share opinions and reactions to market events. This makes it particularly useful for quickly understanding what the market is talking about around a specific stock.
However, Yahoo Finance is less focused on deep financial analysis. While the platform provides financial statements and key metrics, the data is mostly historical and the visualization tools remain relatively basic. Investors looking for more advanced screening, forward-looking estimates, or integrated valuation analysis will typically need additional research platforms. We explore these differences in more detail in our guide on how Yahoo compares with Gainify.
Main features
Yahoo Finance functions primarily as a market monitoring platform where price data, news, and basic financial information are combined into a single interface.
Feature | Description |
|---|---|
Real-time market data | Provides live price quotes, historical price charts, and market summaries across global equities, ETFs, crypto, bonds, and commodities. |
News aggregation | One of the strongest financial news hubs available, combining headlines, earnings coverage, analyst commentary, and macroeconomic updates. |
Community discussion | Each stock page includes an active discussion feed where investors share opinions, news reactions, and market sentiment around specific companies. |
Price charting tools | Interactive charts allow investors to track historical price movements and apply common technical indicators. |
Basic stock screener | Yahoo Finance includes a screener for filtering companies by market cap, sector, valuation ratios, and performance metrics. |
Financial data tables | Company pages include income statements, balance sheets, and cash flow data, although the presentation is mostly historical and relatively static. |
Pros
Yahoo Finance remains one of the most accessible platforms for following markets and monitoring stock prices.
✅ One of the most widely used free stock market information platforms
✅ Strong real-time news aggregation and market commentary
✅ Clean price charts with multiple technical indicators
✅ Coverage across stocks, ETFs, crypto, bonds, and other assets
✅ Active community discussions around individual stocks
✅ Free access to most core market data
Overall, Yahoo Finance works best as a market monitoring and news platform rather than a full research terminal.
Cons
Despite its popularity, the platform has several limitations for deeper investment research.
⚠️ Financial data tools remain largely historical and relatively static
⚠️ Limited functionality for fundamental analysis and valuation modeling
⚠️ Stock screener capabilities remain behind specialized platforms
⚠️ Advanced charting features and data exports require paid plans
⚠️ Free version includes frequent advertisements
The platform is most effective for tracking markets and following financial news, but investors seeking deeper analytical tools will usually need additional research platforms.
Pricing
Yahoo Finance offers a free version alongside tiered premium subscriptions with additional research tools and datasets.
- Free: Includes real-time quotes, price charts, financial news, community discussions, and basic company financials.
- Bronze ($7.95/mo billed yearly): Focused on portfolio tracking and risk monitoring, including diversification tools, community sentiment insights, and an ad-free experience.
- Silver ($19.95/mo billed yearly): Adds Morningstar ratings, expert stock picks, premium financial news, research reports, and alerts for analyst rating changes.
- Gold ($39.95/mo billed yearly): The most advanced tier, including downloadable historical financial data, advanced screeners, technical chart patterns, and up to 40 years of company financial statements.
The premium plans primarily expand access to research reports, historical datasets, and technical analysis tools, while the free version remains sufficient for basic market monitoring and news tracking.
Best for
Yahoo Finance is best suited for investors who want a free platform for monitoring markets, reading financial news, and tracking stock prices. It works particularly well as a daily market dashboard or news source alongside more advanced stock analysis tools used for deeper research.
Simply Wall St
While reviewing stock analysis platforms, I found that Simply Wall St takes a very different approach to company research by focusing on visual storytelling rather than detailed financial datasets. Instead of presenting long financial tables or complex spreadsheets, the platform converts company fundamentals into easy-to-read graphics that help investors quickly understand how a business performs.
The platform is widely recognized for its “snowflake analysis”, a visual model summarizing valuation, growth, financial health, dividends, and past performance. This framework simplifies financial data into a single snapshot, allowing investors to quickly evaluate whether a company appears attractive based on several key factors.
That visual simplicity is the main strength of Simply Wall St, but it also creates some limitations. Individual stock pages provide clear explanations of financial health and analyst expectations, yet once investors want to dig deeper, the dataset becomes relatively static. Compared with top stock analysis tools, customization of financial charts, deeper metric comparisons, or large-scale company screening is more limited.
Another area where the platform performs well is portfolio tracking. Investors can sync brokerage accounts or manually track positions, allowing the system to provide diversification insights and portfolio performance monitoring. However, both watchlists and portfolio dashboards remain fairly structured and offer limited customization, a limitation we examine further in our guide on how Simply Wall St compares with Gainify.
Main features
Simply Wall St focuses on simplifying company fundamentals through visual dashboards and structured research pages.
Feature | Description |
|---|---|
Snowflake analysis | A visual summary highlighting valuation, growth, financial health, dividends, and past performance in a single chart. |
Company research pages | Structured reports explaining financial trends, risks, analyst forecasts, and valuation assumptions. |
Portfolio tracking | Allows investors to sync brokerage accounts or manually track holdings to monitor diversification and performance. |
Watchlists | Enables investors to follow companies and receive updates when valuations or financial indicators change. |
Investment insights | Provides simplified explanations of financial metrics and valuation assumptions for each company. |
Localized market data | The platform can adapt financial data and companies based on the investor’s geographic market. |
Pros
Simply Wall St stands out for presenting financial analysis in a way that is much easier for retail investors to understand.
✅ One of the most intuitive visual interfaces for fundamental analysis
✅ Unique snowflake framework simplifying complex financial data
✅ Clear company reports explaining financial performance and risks
✅ Portfolio syncing and diversification insights
✅ Simply Wall St’s desktop and mobile apps, as well as a Chrome extension
✅ Global market coverage with localized company data
In practice, the platform works best as a visual research layer that helps investors quickly interpret company fundamentals.
Cons
Despite its strong visual interface, several limitations appear when using the platform for deeper research workflows.
⚠️ Financial datasets are relatively shallow compared with professional research platforms
⚠️ Difficult to build custom analytical views or modify financial metrics
⚠️ Portfolio and watchlist dashboards offer limited structural flexibility
⚠️ Screening capabilities are basic for large-scale stock discovery
⚠️ Very limited functionality available in the mid-tier subscription plan
⚠️ No AI-assisted tools to accelerate company research
⚠️ Gap in top investor tracking
The platform is therefore strongest as a visual overview tool, but investors conducting deeper financial modeling or large-scale screening will typically require additional research platforms.
Pricing
Simply Wall St offers three subscription tiers with increasing research access.
- Free ($0): Includes five company reports per month, one portfolio with up to 10 holdings, one watchlist, and limited screening tools.
- Premium ($10.95/mo billed yearly): Expands access to 30 company reports per month, three portfolios, three watchlists, brokerage syncing, and additional screening capabilities.
- Unlimited ($21.50/mo billed yearly): Provides unlimited company reports, multiple portfolios and watchlists, additional screeners, and expanded research access.
The paid plans mainly increase the number of company reports and expand portfolio tracking capabilities.
Best for
Simply Wall St is best suited for investors who prefer visual explanations of company fundamentals rather than complex financial datasets. It is particularly helpful for beginners or investors who want a quick, easy-to-understand overview of a company before conducting deeper research on more advanced platforms.
TIKR
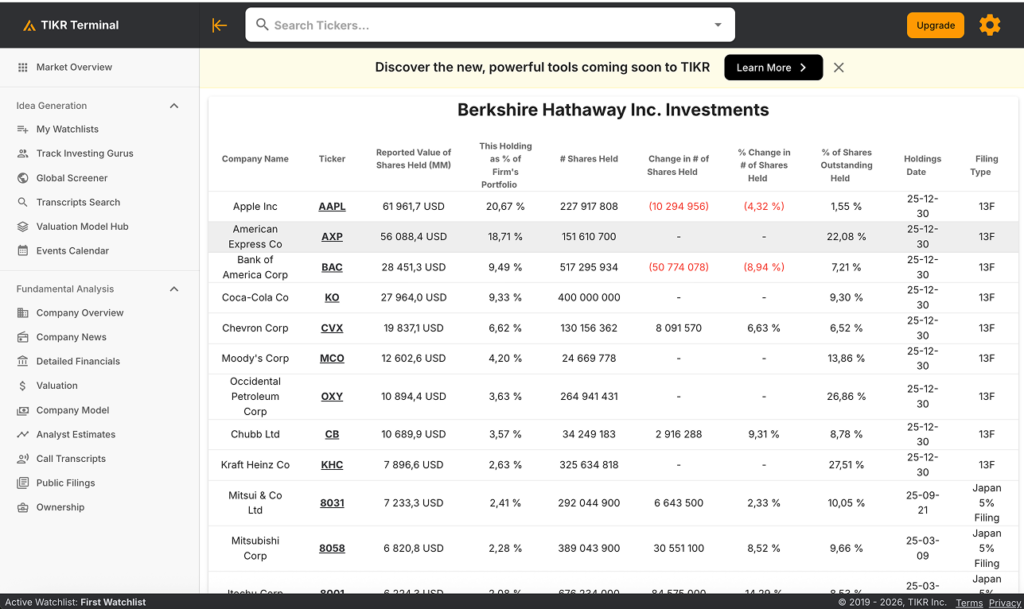
When I tested TIKR alongside other stock research tools, it felt closer to a lightweight financial terminal than a typical retail investing app. The platform is built around structured financial datasets rather than visual dashboards, which makes it particularly appealing to investors who want to work directly with company financial statements and analyst estimates.
At the core of the platform is institutional financial data sourced from S&P Global Market Intelligence. Company pages include detailed income statements, balance sheets, cash flow histories, valuation metrics, and analyst forecasts. For investors used to reviewing financial statements line by line, the platform provides a very structured way to navigate through a company’s fundamentals.
The trade-off is that the interface can feel quite data heavy. Most information is displayed through financial tables rather than interactive visualizations, so users often need to interpret the numbers themselves. While this gives transparency and depth, it also means research can take longer compared with platforms that automate parts of the analysis.
TIKR also integrates a Reuters news feed, which brings company-specific headlines and broader market updates directly into the research workflow. Combined with its financial datasets, this makes the platform useful for investors who want both company fundamentals and relevant market news in one place.
Main features
TIKR focuses on delivering institutional-quality datasets and company financial information.
Feature | Description |
|---|---|
Institutional financial data | Detailed financial statements, valuation metrics, and analyst estimates sourced from S&P Global Market Intelligence. |
Historical financial datasets | Long-term financial history across income statements, balance sheets, and cash flow metrics. |
Analyst estimate database | Forward projections for revenue, earnings, and other financial metrics based on analyst consensus. |
Institutional ownership tracking | Visibility into positions held by large funds and institutional investors. |
Reuters news integration | Company-specific headlines and market updates embedded within research pages. |
Global company coverage | Access to thousands of companies listed across major global exchanges. |
Pros
TIKR works well for investors who prefer direct access to financial datasets and institutional-style research tools.
✅ Strong financial statement coverage for long-term fundamental analysis
✅ Terminal-style layout for investors using professional research tools
✅ Clean access to raw financial datasets without unnecessary visual layers
✅ Useful platform for building detailed valuation models
✅ Reliable data source improves confidence in company fundamentals
✅ Financial information is organized logically across company pages
The platform operates as a data-focused research terminal designed for investors comfortable working directly with financial statements and datasets.
Cons
The platform’s terminal-style structure also introduces several limitations for many investors.
⚠️ Interface relies heavily on financial tables and is less visual than many modern research platforms
⚠️ Limited charting tools for visualizing financial metrics and trends
⚠️ No AI-assisted tools to highlight key changes in financials
⚠️ Comparing companies often requires manual navigation
⚠️ Platform can feel complex for investors unfamiliar with detailed financial statements
The platform prioritizes data depth and structured financial datasets, which makes it better suited for experienced investors comfortable working directly with company fundamentals.
Pricing
TIKR offers both free and paid subscription tiers depending on how much financial data you want to access.
- Free: Provides access to basic company financials, limited analyst estimates, and a restricted number of company reports.
- Plus ($17.95/mo billed yearly): Expands access to deeper financial datasets, more analyst estimates, and additional research features.
- Pro ($37.95/mo billed yearly): Unlocks the full financial dataset, expanded analyst coverage, and advanced company research tools.
Paid tiers primarily increase access to deeper datasets and analyst estimate coverage.
Best for
TIKR is best suited for investors who want access to institutional-style financial datasets and detailed company financial statements without paying the cost of professional terminals. The platform works particularly well for investors comfortable navigating financial tables, reviewing multi-year financial histories, and building their own valuation models from structured data.
Fiscal.ai
Fiscal.ai takes a fundamentally different approach to stock analysis by focusing on operational drivers that determine how companies create and compound economic value. While most stock research platforms concentrate on financial statements and valuation ratios, Fiscal.ai goes deeper into the business model itself by tracking operational KPIs and segment-level performance data.
For many companies, the true drivers of long-term value are not visible in standard financial statements. Subscription businesses depend on subscriber growth and churn, marketplaces on transaction volumes and take rates, and software companies on customer retention and expansion metrics. Fiscal.ai collects these operational indicators and connects them directly with financial performance, giving investors a clearer view of how companies generate revenue, margins, and return on capital.
Fiscal.ai also allows users to create their own financial indicators using formula-based calculations, enabling deeper analysis of unit economics, segment profitability, and long-term business trends. This makes the platform particularly useful for investors who want to analyze companies beyond headline financial metrics.
At the same time, the platform increasingly targets data-driven research workflows and enterprise use cases, offering APIs and analytical infrastructure. While this adds powerful analytical capabilities, it also means the platform is less focused on portfolio tracking or end-to-end investment workflows than some competing research platforms.
Main features
Fiscal.ai emphasizes financial datasets, operational KPIs, and customizable analytical tools.
Feature | Description |
|---|---|
KPI and segment datasets | Coverage of operational metrics across 2,500+ companies, including subscriber counts, transaction volumes, and geographic revenue segments. |
Institutional financial data | Financial statements and valuation metrics sourced from S&P Global Market Intelligence. |
Financial history | Access to up to 20+ annual periods and 40+ quarterly periods depending on plan tier. |
Analyst estimates | Forward projections for revenue, earnings, and other metrics with up to 3 annual and 5 quarterly forecast periods. |
Custom dashboards | Ability to build dashboards with up to 250 financial metrics per dashboard for company comparisons. |
Custom metrics | Investors can create proprietary metrics using formula-based calculations. |
Earnings transcripts | Access to earnings calls, transcripts, investor presentations, and filings. |
Data export | Higher tiers allow CSV downloads and direct data exports for external analysis. |
Pros
Fiscal.ai stands out for investors who want granular company analysis beyond standard financial statements.
✅ Segment and KPI datasets covering 2,500+ companies globally
✅ Financial data sourced from S&P Global Market Intelligence
✅ Up to 20+ years of financial history and 40+ quarterly periods
✅ Custom formulas allow investors to build proprietary financial metrics
✅ Strong charting and visualization for financial and operational data
✅ Detailed earnings transcripts and company filings integration
These capabilities make Fiscal.ai particularly useful for industry research where operational KPIs are central to company performance.
Cons
Despite its strong datasets, the platform has several limitations for many investors.
⚠️ Pricing has increased significantly compared with earlier versions
⚠️ Stock screener functionality remains relatively basic
⚠️ No portfolio synchronization for tracking holdings
⚠️ Limited coverage of top investors and institutional portfolios
⚠️ AI functionality remains relatively limited
⚠️ Platform increasingly oriented toward enterprise data workflows
Because of this, Fiscal.ai often works best as a specialized data analysis tool rather than a complete research and portfolio management platform.
Pricing
Fiscal.ai offers three subscription tiers with increasing levels of dataset access.
- Free ($0/mo): Includes 10 years and 6 quarters of financials, 2 years of KPI data, one dashboard (30 rows), limited events (calls, transcripts, slides), and 1 year of analyst estimates.
- Pro ($39/mo): Adds 15 years and 20 quarters of financials, 10 years of KPI data, up to 10 dashboards (100 rows), expanded events access, 2 years of analyst estimates, and adjusted financial figures.
- Max ($79/mo): Unlocks 20+ years and 40+ quarters of financials, 15+ years of KPI data, unlimited dashboards, full events and transcripts access, extended estimates, and data export with auditability to filings.
Best for
Fiscal.ai is best suited for investors and analysts who want deep operational metrics and segment-level company data. The platform works particularly well when evaluating industries where metrics such as subscriber growth, transaction volumes, or geographic revenue distribution provide important insight into business performance.
However, investors looking for portfolio monitoring, advanced screening tools, or AI-assisted research workflows may need additional stock research platforms alongside Fiscal.ai.
Koyfin
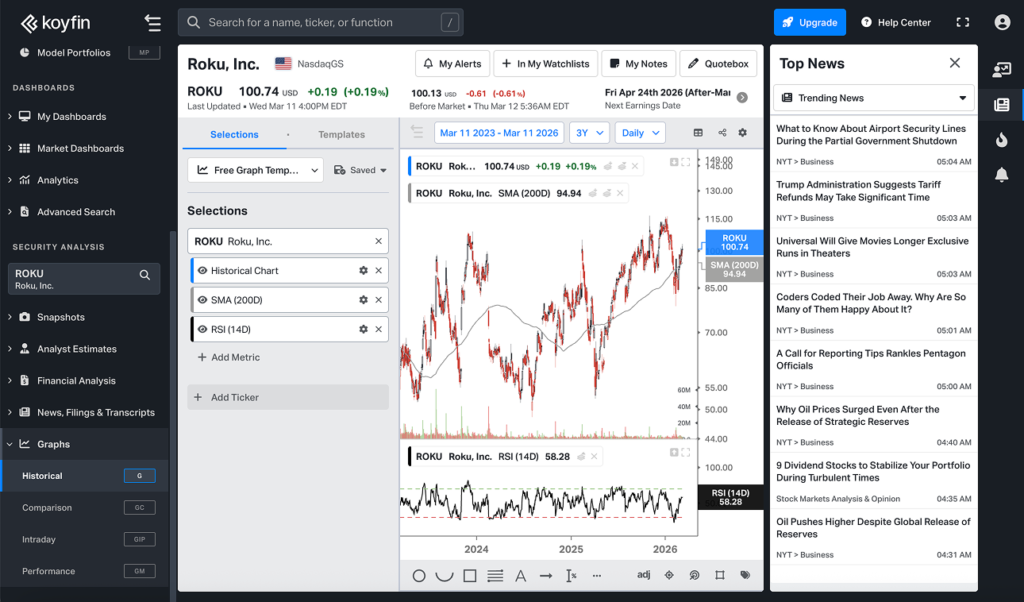
In my opinion, Koyfin is designed as a multi-asset financial research platform, combining equity analysis with macroeconomic datasets, market dashboards, and advanced charting tools. Unlike platforms focused solely on stock fundamentals, Koyfin integrates data across equities, ETFs, bonds, currencies, commodities, and macroeconomic indicators, allowing investors to analyze markets from both a company and macro perspective.
One of Koyfin’s strongest capabilities is its highly customizable dashboard environment. Investors can build personalized market dashboards that combine price charts, financial metrics, economic indicators, and watchlists into a single workspace. This flexibility allows users to track market movements, company fundamentals, and macroeconomic trends simultaneously.
The platform also integrates TradingView charting technology, providing a large library of technical indicators and advanced chart customization. These widgets make Koyfin particularly appealing to investors who combine fundamental analysis with technical charting when evaluating investment opportunities.
However, while the platform offers extensive functionality, the overall user experience can feel complex. Many tools are accessed through table-based interfaces or multiple configuration panels, which can make navigation slower compared with more streamlined research platforms.
Main features
Koyfin focuses on combining financial data, macroeconomic analysis, and charting tools into a customizable research environment.
Feature | Description |
|---|---|
Multi-asset market coverage | Analysis across stocks, ETFs, bonds, commodities, currencies, and macroeconomic datasets. |
Custom market dashboards | Investors can build personalized dashboards combining financial charts, data tables, and economic indicators. |
TradingView charting | Integrated TradingView charts with a large selection of technical indicators and drawing tools. |
Financial statements and estimates | Company financial statements and consensus analyst estimates with long-term historical data. |
Watchlists and alerts | Watchlists with market tracking, price alerts, and custom monitoring dashboards. |
Economic and macro datasets | Access to yield curves, economic indicators, and global macroeconomic data. |
Pros
Koyfin is particularly appealing to investors who want to analyze markets from both a macro and company-level perspective within one research environment.
✅ Useful for combining macro analysis with company-level research
✅ Strong environment for building personalized market monitoring dashboards
✅ Advanced charting widgets suitable for technical traders
✅ Helpful for tracking cross-asset relationships such as equities vs. bonds
✅ Advisor-focused tools support professional research workflows
These strengths make Koyfin most valuable for investors who want to analyze broader market dynamics alongside individual securities rather than focusing solely on stock fundamentals.
Cons
Despite its powerful datasets, the platform has several usability limitations.
⚠️ Interface can feel complex and difficult to navigate
⚠️ Many tools rely on table-based layouts rather than intuitive visual workflows
⚠️ Customization options often require multiple configuration steps
⚠️ No direct brokerage synchronization for portfolio tracking
⚠️ Limited AI-assisted analysis compared with newer research platforms
⚠️ Pricing tiers increase quickly as advanced functionality is unlocked
Because of these factors, Koyfin often feels more like a data analysis workspace than a streamlined stock research platform.
Pricing
Koyfin offers several subscription tiers with increasing access to data coverage and analytical tools.
- Free ($0/mo): Includes basic dashboards, limited watchlists, 2 financial statement years, and a restricted stock screener.
- Plus ($39/mo): Adds expanded financial datasets, unlimited watchlists, deeper historical data, and additional screening functionality.
- Premium ($79/mo): Unlocks full market coverage, expanded data downloads, and advanced analytical tools.
- Advisor Core ($209/mo) / Advisor Pro ($299/mo): Professional tiers designed for advisors with client portfolio tracking, reporting tools, and custodian integrations.
Best for
Koyfin is best suited for investors who want multi-asset market research combining macro data, company fundamentals, and advanced charting tools. The platform works particularly well for users building customized dashboards to track global markets and financial indicators.
However, investors looking for simpler workflows, integrated portfolio synchronization, or AI-assisted research tools may find the platform more complex than necessary for everyday stock analysis.
Finviz
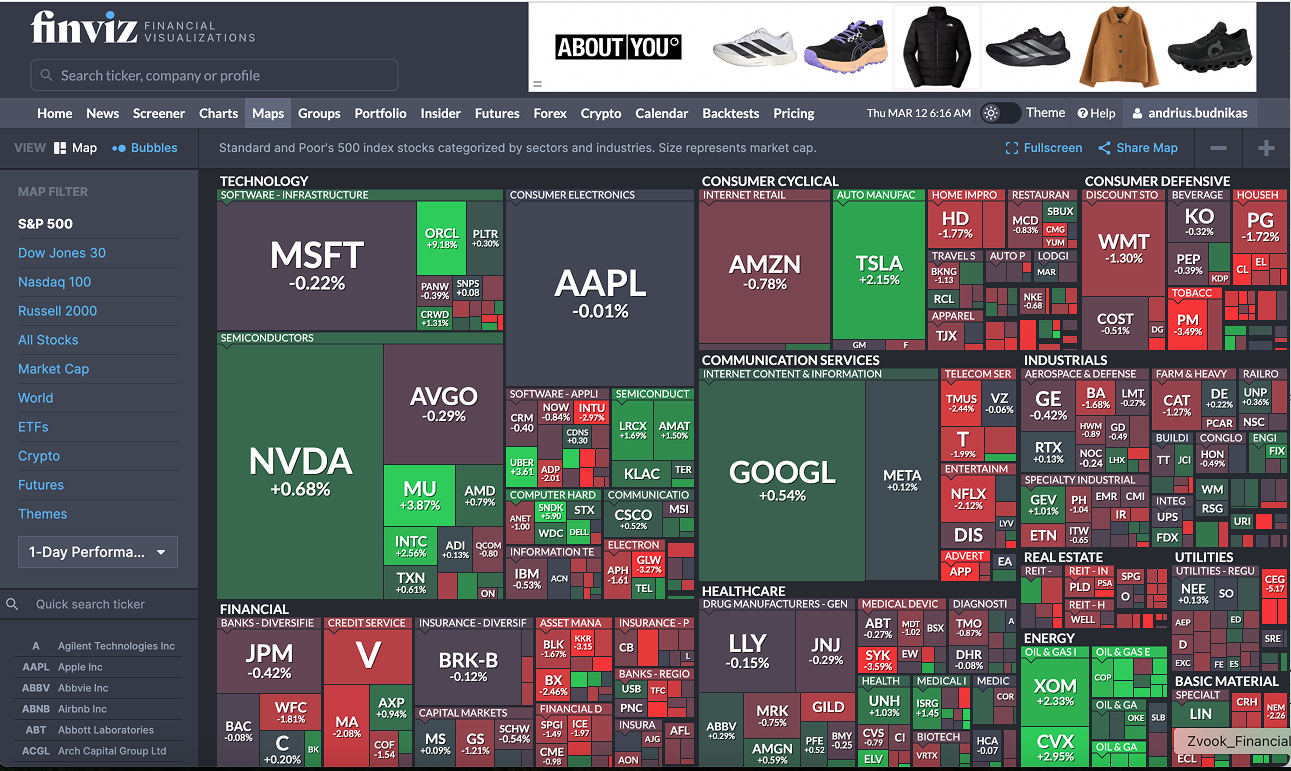
Finviz is one of the longest-running stock market research platforms, widely used by traders and investors for its fast stock screener and distinctive market heatmaps. Rather than focusing on deep company analysis, the platform is designed primarily for idea generation and market monitoring, helping investors quickly filter thousands of stocks based on technical signals, financial metrics, and price performance.
Based on my research, at the core of Finviz is its high-speed stock screener, which allows users to filter companies using dozens of technical and fundamental indicators. These include valuation ratios, growth metrics, profitability measures, insider trading activity, and technical signals such as moving averages, RSI, and price momentum. Results are displayed in table-based layouts optimized for quickly scanning large groups of stocks.
Another defining feature of the platform is its interactive market heatmap, which visually displays market performance across sectors and individual companies. This visualization allows investors to quickly identify sector rotation, outperforming industries, and broader market trends.
Finviz also includes technical charting tools, news feeds, insider trading data, and strategy backtesting capabilities. The premium Finviz Elite plan unlocks real-time market data, intraday charts, alerts, and advanced chart layouts.
However, the platform remains largely table-driven and focused on data filtering rather than deep company analysis. Individual stock pages contain relatively limited financial information compared with modern research platforms. As a result, Finviz is often used as a screening tool alongside more comprehensive stock analysis platforms. Investors interested in a deeper breakdown of the differences can read our guide on how Finviz compares with Gainify.
Main features
Finviz focuses on market visualization, stock discovery, and technical screening.
Feature | Description |
|---|---|
Stock screener | Filtering engine with dozens of technical indicators and financial metrics including valuation ratios, profitability measures, and price signals. |
Market heatmaps | Visual maps showing sector performance and stock-level price movements across the market. |
Technical charting | Charts with common technical indicators and multi-layout charts in the Elite plan. |
Strategy backtesting | Ability to test trading strategies using historical technical signals. |
News aggregation | Real-time financial news headlines and company-specific news feeds. |
Multi-asset coverage | Coverage includes stocks, forex, futures, and crypto markets. |
Pros
Finviz remains one of the most efficient tools for quickly identifying potential stock opportunities through screening and market visualization.
✅ Extremely fast stock screener capable of filtering large stock universes
✅ Market heatmaps provide a clear visual view of sector performance
✅ Strong coverage of technical indicators for trading strategies
✅ Simple interface designed for scanning many stocks quickly
✅ Includes forex, futures, and crypto market tracking
✅ Built-in backtesting capabilities for technical trading strategies
These capabilities make Finviz particularly effective for stock discovery and technical market analysis.
Cons
Despite its strengths in screening, the platform has several limitations.
⚠️ Individual stock pages contain limited fundamental analysis tools
⚠️ Research interface relies heavily on table-based data displays
⚠️ Limited customization compared with newer research platforms
⚠️ Stock coverage primarily focused on US equities
⚠️ No AI-powered tools for summarizing financial data or filings
Because of these limitations, Finviz is often used as a screening and market monitoring tool alongside more comprehensive research platforms.
Pricing
Finviz offers both a free version and a premium subscription called Finviz Elite.
- Free: Includes delayed quotes, stock screening tools, market heatmaps, news feeds, and basic company financial statements.
- Elite ($39.50/mo): Adds real-time market data, intraday charts, advanced technical indicators, custom alerts, backtesting functionality, and expanded charting tools.
Best for
Finviz is best suited for investors who want a fast and efficient stock screener combined with strong market visualization tools. The platform works particularly well for traders and active investors who rely on technical indicators, sector performance analysis, and screening tools to identify potential opportunities.
However, investors looking for deep company analysis, forward-looking financial estimates, or integrated portfolio research workflows will typically use Finviz alongside more comprehensive stock research platforms.
Alpha Spread
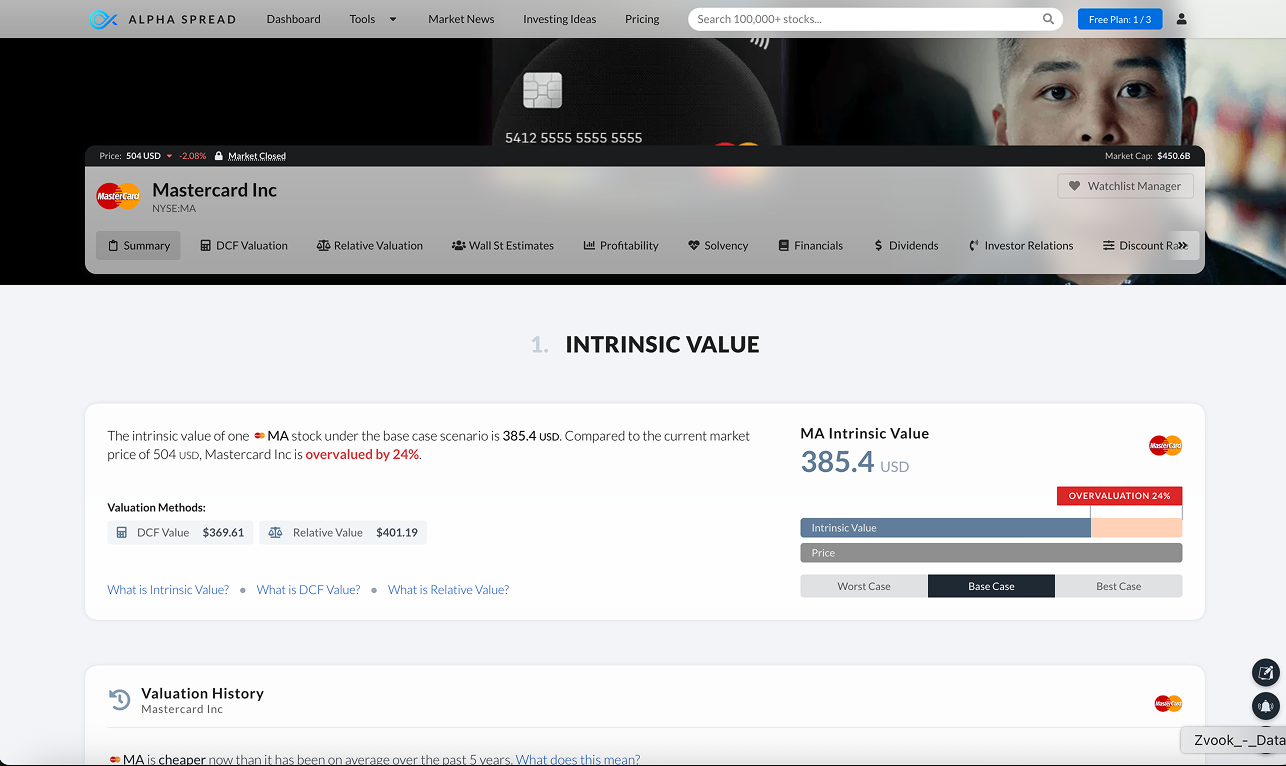
AlphaSpread is built primarily for investors focused on valuation modeling and intrinsic value analysis. The platform centers its research workflow around discounted cash flow (DCF) models, relative valuation comparisons, and structured investment frameworks designed to evaluate whether a stock is under- or overvalued.
One of the most distinctive aspects of AlphaSpread is how valuation modeling is integrated directly into each company profile. Investors can quickly adjust key assumptions such as revenue growth, margins, and discount rates to build custom valuation scenarios. The platform then visualizes the resulting fair value range, making it easier to evaluate potential upside or downside.
AlphaSpread also includes pre-built value investing screeners, inspired by frameworks commonly used by fundamental investors. These include strategies such as “sensibly priced quality,” “significantly undervalued,” and Joel Greenblatt’s well-known “Magic Formula” approach. These preset filters help investors quickly identify potential opportunities based on valuation and profitability metrics.
Another useful component is the relative valuation section, which compares a company’s multiples and financial metrics against industry peers. This allows investors to quickly understand whether a stock trades at a premium or discount relative to competitors.
The platform also includes an AI assistant, investment journals, alerts, and structured company reports that summarize key financial information and valuation insights.
However, AlphaSpread is primarily designed around single-company analysis rather than broad research workflows. Features such as watchlists, alerts, and screening capabilities remain relatively basic compared with more comprehensive research platforms. The interface also feels slightly dated and can become slow when loading complex valuation models.
Main features
AlphaSpread focuses primarily on valuation modeling and structured company analysis.
Feature | Description |
|---|---|
DCF valuation modeling | Core platform functionality allowing investors to build and adjust discounted cash flow models directly inside company pages. |
Relative valuation analysis | Comparison of valuation multiples across peer companies and industry groups. |
Value investing screeners | Pre-built screeners based on classic value strategies such as Magic Formula and undervalued quality stocks. |
Company research reports | Structured summaries including financial metrics, insider transactions, and valuation insights. |
AI research assistant | Chat-based AI tool used to analyze companies and summarize financial information. |
Investment journals and alerts | Basic portfolio monitoring tools including price alerts and research tracking. |
Pros
AlphaSpread provides a strong environment for investors focused specifically on valuation-driven analysis.
✅ Powerful built-in discounted cash flow modeling tools
✅ Well-designed relative valuation comparisons between peers
✅ Pre-built screeners based on classic value investing strategies
✅ Detailed company-level financial and valuation analysis
✅ AI assistant for summarizing financial data and reports
✅ Clear visualization of fair value scenarios and assumptions
These features make the platform particularly useful for investors who rely heavily on intrinsic value modeling when evaluating companies.
Cons
Despite its strengths in valuation analysis, the broader platform functionality remains limited.
⚠️ Interface design feels dated compared with newer research platforms
⚠️ Platform performance can slow when loading complex valuation models
⚠️ Watchlists and alerts offer limited customization options
⚠️ Screening capabilities remain relatively basic
⚠️ Data sources and real-time update frequency are not clearly disclosed
Because of these limitations, AlphaSpread works best as a valuation modeling tool rather than a full research ecosystem.
Pricing
AlphaSpread offers three pricing tiers with increasing access to company reports and research tools.
- Free ($0): Includes access to 3 stock reports per week, basic AI assistant usage, one watchlist, and core valuation tools.
- Premium (~$12/month): Expands access to 15 stock reports per week, additional AI assistant prompts, valuation backtesting tools, and up to five watchlists.
- Unlimited (~$20/month): Removes limits on stock reports, unlocks the full stock screener, increases AI assistant usage, and expands watchlists and stock coverage.
Higher enterprise tiers are also available for professional investors and research teams.
Best for
AlphaSpread is best suited for investors who want a valuation-first research platform focused on intrinsic value modeling. The platform works particularly well for investors who prefer building or adjusting discounted cash flow models to estimate fair value rather than relying solely on analyst estimates or automated ratings.
However, investors looking for broader research workflows including advanced screening, portfolio monitoring, or integrated market analysis may find the platform’s ecosystem relatively limited compared with more comprehensive research platforms.
Magnifi
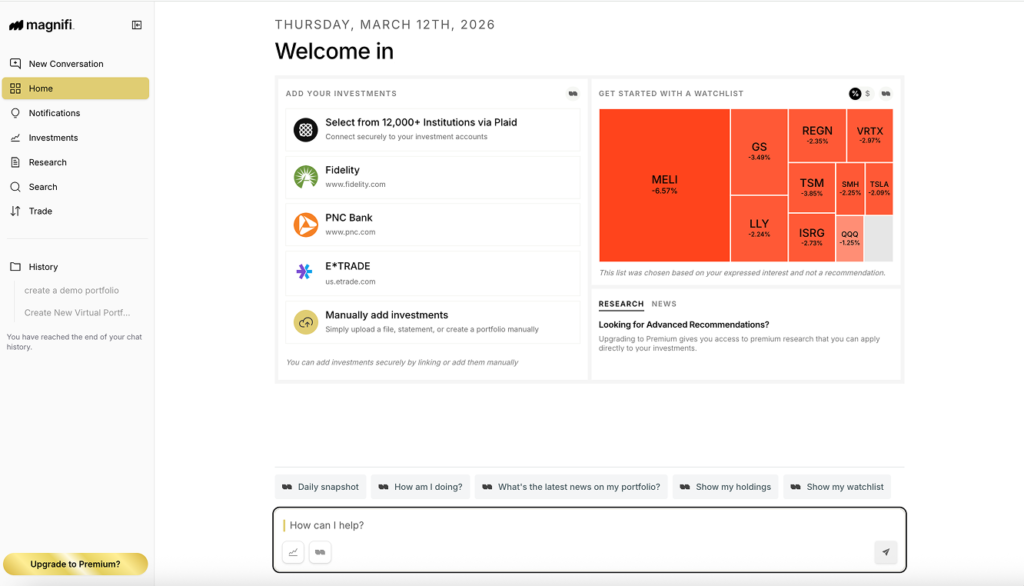
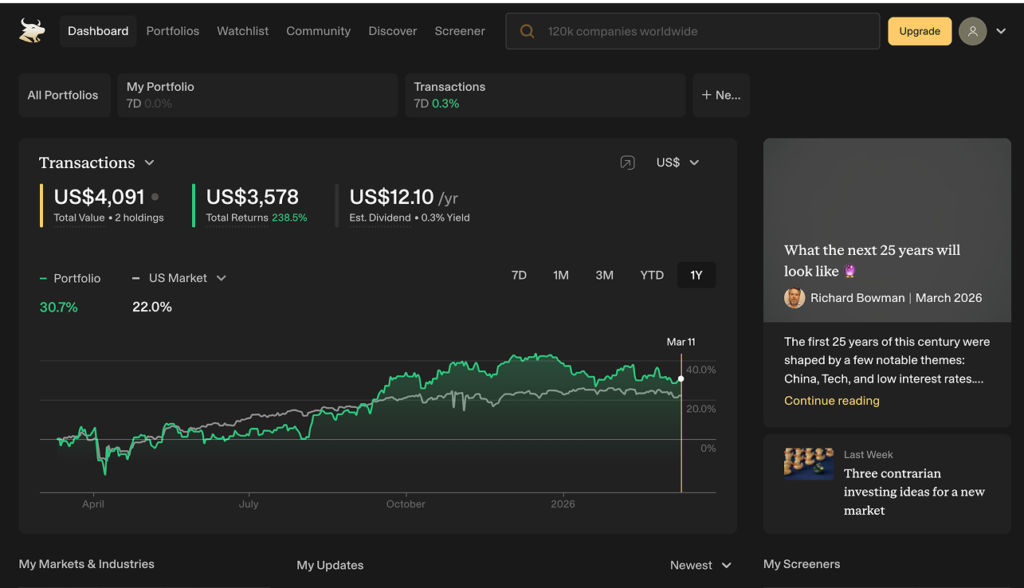
I tested Magnifi while reviewing AI-driven investing platforms, and the platform clearly focuses on portfolio intelligence rather than deep company-level research. Instead of starting with stock screening or financial modeling, Magnifi centers the experience around understanding your current holdings and helping you make better portfolio decisions.
One of the most useful elements is its Plaid-powered account integration, which allows you to connect brokerage accounts such as Robinhood, Schwab, and E*TRADE. Once accounts are linked, Magnifi aggregates all holdings into a single dashboard and analyzes diversification, risk exposure, and portfolio performance across accounts.
The platform’s main interaction model is a conversational AI search interface. Investors can ask questions like “How diversified is my portfolio?” or “Which ETFs have the lowest fees?” and receive investment insights or potential ideas. This approach removes the need to manually navigate complex screeners or financial datasets.
Another distinguishing feature is that Magnifi allows users to execute commission-free trades directly inside the platform. Unlike most research tools that stop at analysis, Magnifi attempts to combine portfolio insights with trade execution in a single workflow.
That said, the platform is primarily designed for portfolio guidance rather than deep fundamental analysis. Company-level research tools remain fairly limited and are partially powered through external integrations. The interface also feels somewhat dated and the platform can become slow when loading portfolio analytics or processing AI queries.
Main features
Magnifi focuses primarily on AI-driven portfolio analysis and investment decision support.
Feature | Description |
|---|---|
AI investment search | Natural-language search allowing users to ask questions about stocks, ETFs, and investment strategies. |
Portfolio aggregation | Connect brokerage accounts through Plaid to track multiple portfolios in one dashboard. |
Portfolio analytics | Insights into diversification, asset allocation, risk exposure, and portfolio performance. |
Goal-based investing | Build financial plans for goals such as retirement, savings, or income generation. |
Commission-free trading | Buy and sell stocks and ETFs directly within the platform. |
AI portfolio guidance | Personalized insights designed to improve portfolio health and long-term performance. |
Pros
Magnifi provides a portfolio-focused investing experience centered on AI insights and account aggregation.
✅ Plaid integration allows syncing multiple brokerage accounts
✅ AI-powered investment search simplifies portfolio analysis
✅ Commission-free trading available directly in the platform
✅ Portfolio analytics highlighting diversification and risk exposure
✅ Goal-based investing tools for long-term financial planning
✅ Weekly portfolio insights and performance monitoring
These capabilities make Magnifi particularly useful for investors who want automated portfolio guidance across multiple accounts.
Cons
Despite its strengths in portfolio monitoring, several limitations affect the broader research workflow.
⚠️ Interface design feels dated compared with newer investment platforms
⚠️ Platform performance can be slow when running AI queries
⚠️ Company-level analysis tools remain fairly limited
⚠️ AI assistant focuses on basic portfolio questions rather than deep analysis
⚠️ Screening and valuation tools are less advanced than dedicated research platforms
Because of these limitations, Magnifi functions best as a portfolio intelligence tool rather than a comprehensive stock research environment.
Pricing
Magnifi offers a free tier alongside a premium subscription with expanded analytics and AI guidance.
- Free: Includes portfolio tracking, AI investment search, goal tracking tools, and basic portfolio insights.
- Premium ($99/year): Adds scenario testing, predictive portfolio forecasting, advanced risk analytics, and personalized AI investment guidance.
Premium subscribers also receive deeper portfolio health monitoring and enhanced investment insights.
Best for
Magnifi is best suited for investors who want AI-assisted portfolio management with consolidated account tracking. The platform works particularly well for users managing multiple brokerage accounts who want to analyze diversification, risk exposure, and investment goals in a single interface.
However, investors seeking deep company analysis, advanced screening tools, or detailed financial modeling will typically combine Magnifi with more specialized stock research platforms.
TradingView
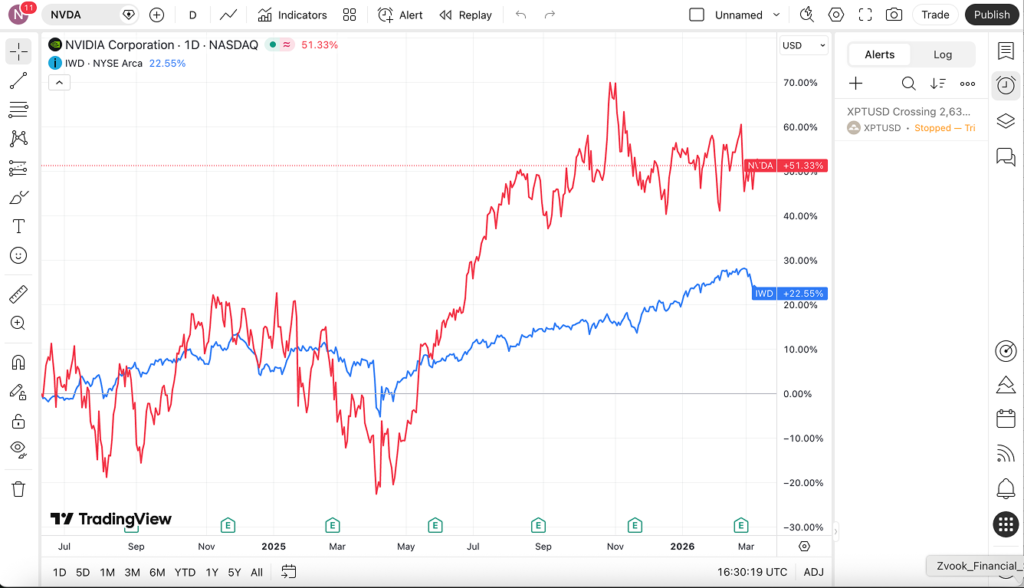
I tested TradingView while comparing several stock research platforms, and it is clear why the platform has become the global standard for technical charting and price-based trading analysis. The entire ecosystem is built around charting, market monitoring, and real-time trading signals rather than deep company research.
At the center of the platform is its advanced charting engine, which allows users to build highly customizable charts using hundreds of indicators and drawing tools. Traders can analyze multiple timeframes simultaneously, overlay indicators, and create complex technical setups that help identify momentum, support and resistance levels, and trend reversals.
Another major advantage is the platform’s alert system. TradingView allows investors to set alerts based on price levels, indicator conditions, or technical signals. These alerts can be delivered through web notifications, mobile alerts, or email, making it easier for traders to react quickly when market conditions change.
TradingView also supports multiple asset classes, including stocks, ETFs, forex, futures, cryptocurrencies, and global indices. This makes it particularly useful for traders who follow macro trends or move between markets.
In addition to charting tools, TradingView includes a large social investing community where traders publish charts, technical setups, and market commentary. Investors can follow other analysts, share trading ideas, and explore community-generated strategies directly within the platform.
However, the platform is primarily designed around price action and technical signals rather than fundamental research. While TradingView includes basic financial metrics and screeners, it lacks deeper company analysis tools such as valuation models, analyst estimates, and detailed financial statement breakdowns. Investors interested in a deeper comparison can read our guide on how TradingView compares with Gainify.
Main features
TradingView focuses on technical analysis, real-time market monitoring, and chart-based trading tools.
Feature | Description |
|---|---|
Advanced technical charting | Highly customizable charts with hundreds of indicators, drawing tools, and multi-timeframe layouts. |
Multi-asset coverage | Supports equities, ETFs, forex, futures, cryptocurrencies, and global indices. |
Technical alerts | Alerts based on price levels, indicator signals, or technical patterns. |
Market screeners | Screeners for stocks, crypto, and forex using price and technical filters. |
Community trading ideas | Large social network where traders share charts, strategies, and market commentary. |
Multi-chart layouts | Ability to monitor several charts simultaneously across different assets or timeframes. |
Pros
TradingView provides one of the most advanced environments for technical traders and market monitoring.
✅ One of the most widely used charting platforms among active traders
✅ Large community sharing thousands of daily trading ideas and strategies
✅ Extremely flexible workspace layouts for monitoring multiple markets
✅ Strong ecosystem of third-party indicators and custom scripts
✅ Reliable alert infrastructure for tracking live market movements
✅ Available across web, desktop, and mobile with synchronized layouts
These capabilities make TradingView particularly valuable for traders who rely heavily on technical analysis and price-based strategies.
Cons
Despite its strengths in charting and technical tools, the platform has limitations for deeper financial research.
⚠️ Limited fundamental company analysis tools
⚠️ No integrated valuation models or intrinsic value analysis
⚠️ Financial statement data remains relatively basic
⚠️ Alerts primarily focus on price and technical indicators
⚠️ Limited tools for analyzing institutional investors or ownership trends
For this reason, TradingView is better positioned as a technical trading tool than a comprehensive investment research platform.
Pricing
TradingView offers several subscription tiers that expand charting limits, alerts, and advanced technical analysis tools.
- Free: Includes basic charting tools, limited indicators per chart, and access to the TradingView community.
- Essential (€12.95/month billed yearly): Allows 2 charts per tab, 5 indicators per chart, and 20 price alerts, along with custom timeframes and multiple watchlists.
- Plus (€28.29/month billed yearly): Expands limits to 4 charts per tab, 10 indicators per chart, and 100 alerts, adding multi-condition alerts and higher charting flexibility.
- Premium (€56.49/month billed yearly): Includes 8 charts per tab, 25 indicators per chart, and 400 alerts, plus advanced chart replay and data export capabilities.
- Ultimate (€199.95/month billed yearly): The highest tier offering 16 charts per tab, 50 indicators per chart, and up to 1,000 alerts, along with advanced tick-based charting tools and priority support.
Higher tiers primarily increase indicator limits, chart capacity, and alert volumes, making them especially useful for active traders managing multiple markets simultaneously.
Best for
TradingView is best suited for traders who rely on technical analysis, chart patterns, and real-time market signals. The platform is particularly effective for monitoring multiple asset classes and setting automated alerts based on trading setups.
However, investors looking for deep fundamental analysis, valuation modeling, or institutional-grade financial datasets will usually combine TradingView with more specialized stock research platforms.
StockAnalysis
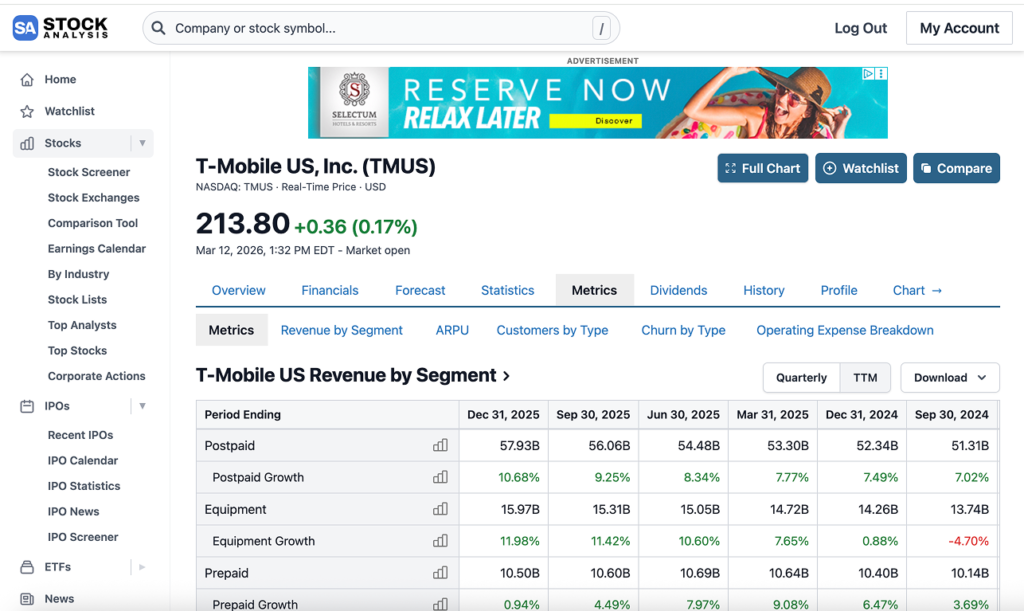
I tested StockAnalysis while comparing stock research platforms, and the tool positions itself as a large financial data library rather than a full investment research ecosystem. The platform focuses on delivering extensive financial histories, detailed company data tables, and broad market coverage in a straightforward interface.
One of the biggest strengths of StockAnalysis is its depth of financial history and company coverage. The platform provides financial statements, dividend history, and business metrics across 130,000+ global stocks and funds, with many companies offering 10–40 years of financial data and long-term dividend histories. This makes it particularly useful for investors who want access to large datasets and historical company information.
Company pages are structured as data-heavy financial profiles, presenting income statements, balance sheets, cash flow statements, and key ratios in clear tabular formats. Investors can also analyze ETF holdings, corporate actions, and analyst forecasts, making the platform helpful for quickly reviewing financial fundamentals.
Another useful capability is the ability to export financial data directly to Excel or CSV, which is valuable for investors building their own valuation models or financial spreadsheets outside the platform.
StockAnalysis also includes industry breakdowns, IPO tracking, and stock screeners, allowing investors to filter companies using financial metrics and explore companies within specific sectors.
However, the platform is designed primarily as a financial data reference tool. The interface feels somewhat dated, and the free version is heavily supported by advertisements. In addition, some financial tables lack clear timestamps for when data was last updated, which can make interpretation less transparent for certain datasets.
Main features
StockAnalysis focuses on financial data access and company-level fundamental information.
Feature | Description |
|---|---|
Extensive financial history | Long-term financial statements and dividend history covering decades for many companies. |
Global stock coverage | Data for 130,000+ global stocks and funds, including ETF holdings. |
Data exports | Financial data can be downloaded directly into Excel or CSV files for external analysis. |
Company financial profiles | Structured company pages with financial statements, ratios, and key metrics. |
Industry and sector analysis | Explore companies by industry groups and compare sector-level financial performance. |
IPO and corporate actions tracking | Dedicated sections tracking new IPOs, corporate events, and business developments. |
Pros
StockAnalysis provides a large and accessible financial database for investors researching company fundamentals.
✅ Very extensive financial history for many companies
✅ Broad global coverage across stocks, funds, and ETFs
✅ Ability to export financial datasets to Excel or CSV
✅ Clear company pages with structured financial statements
✅ Useful industry-level comparisons and sector breakdowns
✅ Dedicated IPO tracking and market overview sections
These capabilities make the platform particularly useful for investors who need long-term financial datasets and company fundamentals in a simple interface.
Cons
Despite its strong data coverage, several usability limitations affect the research experience.
⚠️ Free version includes a very high number of advertisements
⚠️ Interface design feels outdated compared with modern platforms
⚠️ No custom charting building functionality or alerts
⚠️ Screening and filtering tools remain relatively basic
⚠️ Limited advanced analytics or valuation modeling tools
Because of these limitations, StockAnalysis functions best as a financial data reference platform rather than a full investment research environment.
Pricing
StockAnalysis offers three pricing tiers that primarily expand data access and download capabilities.
- Free: Includes limited financial history, ETF holdings data, corporate actions tracking, and access to company profiles. The free version is supported by advertisements.
- Pro ($6.58/month billed yearly): Unlocks full access to data on 130,000+ global stocks and funds, including extended financial histories, analyst forecast filters, saved screeners, and the ability to download financial data.
- Unlimited ($16.58/month billed yearly): Adds unlimited downloads and removes restrictions on the number of stocks per watchlist.
All paid plans include ad-free browsing and expanded financial datasets.
Best for
StockAnalysis is best suited for investors who want fast access to large financial datasets and long-term company fundamentals. The platform works particularly well for users who export financial data into spreadsheets or build their own valuation models.
However, investors looking for integrated portfolio tools, AI analysis, or deeper valuation frameworks will typically combine StockAnalysis with more advanced research platforms.
Best Stock Analysis and Research Tools By Category
Stock research platforms specialize in different parts of the investment workflow. Some focus on charting and technical trading, others on financial statements and valuation, while newer tools integrate AI-driven analysis, screening, and portfolio monitoring.
Because of these differences, the best platform often depends on how you approach investing. Traders may prioritize charting tools and alerts, while long-term investors usually need deeper financial datasets, screening capabilities, and valuation frameworks.
Below is a breakdown of the best stock research tools by category, highlighting where each platform performs best.
Best Free Tools
Free stock research platforms are useful for investors who want basic financial data, stock tracking, and idea discovery without paying for a subscription. While free versions often include ads or limited datasets, they still provide valuable market insights.
Top free platforms:
- Gainify – Free stock screener, AI research assistant, and portfolio monitoring tools
- Yahoo Finance – Free market tracking platform with news, charts, and community discussions
- Finviz – Fast stock screener with heatmaps and technical filters
- StockAnalysis – Extensive financial data library with long-term company financial history
Best Paid Tools
Paid research platforms unlock deeper financial datasets, advanced screening capabilities, charting tools, and professional research workflows.
Top paid platforms:
- Gainify – AI-driven research platform with screening, valuation tools, alerts, and portfolio monitoring
- Koyfin – Multi-asset research platform with customizable dashboards and macro data
- Fiscal.ai – Advanced financial datasets with operational KPIs and segment-level company analysis
- TradingView – Professional charting platform with powerful alerts and trading tools
Best for Charting and Analysis
Charting platforms are designed for investors who rely on technical analysis, indicators, and price patterns to analyze markets and identify trading opportunities.
Top charting platforms:
- TradingView – Industry-leading charting platform with advanced technical indicators and alerts
- Koyfin – Multi-asset charting environment combining technical charts with macroeconomic data
- Finviz – Technical charts combined with market heatmaps and price-based screening
Best for Stock Screening
Stock screeners help investors filter thousands of companies using financial metrics, valuation ratios, or technical indicators. These tools are commonly used during the idea discovery stage of investing.
For a deeper breakdown of screening platforms, see our guide on best stock screeners.
Top screening platforms:
- Gainify – Advanced screener with 1,000+ financial metrics across global markets
- Finviz – Extremely fast simplified screening engine with strong technical filters
- StockAnalysis – Financial screening combined with deep company datasets
- TradingView – Technical-based stock screening and market filtering tools
Best for Fundamental Data
Fundamental research platforms focus on financial statements, analyst estimates, valuation metrics, and company-level datasets.
Top fundamental research platforms:
- TIKR – Institutional financial datasets and analyst estimates sourced from S&P Global
- Fiscal.ai – Operational KPI and segment-level company data
- StockAnalysis – Massive financial database with long-term company histories
Best for Long-Term Investors
Long-term investors usually need tools that combine financial analysis, valuation frameworks, and portfolio monitoring rather than short-term trading signals.
Top platforms for long-term investing:
- Gainify – End-to-end research workflow combining screening, valuation, AI analysis, and portfolio monitoring
- Alpha Spread – Intrinsic value analysis with built-in DCF valuation tools
- Fiscal.ai – Operational KPI analysis for evaluating long-term business performance
- TIKR – Structured financial datasets for deep company analysis
Best for Beginners
Beginner investors often benefit from platforms that simplify company analysis through visual dashboards, clear financial explanations, and intuitive research tools.
If you are new to investing, you can explore more beginner-friendly platforms in our guide on best investing apps for beginners.
Top beginner-friendly platforms:
- Simply Wall St – Visual company analysis using intuitive infographic-style dashboards
- Yahoo Finance – Simple platform for tracking markets and following financial news
- Gainify – Beginner-friendly interface with powerful screening and research tools for learning investors
How to Choose the Best Stock Analysis Tool
The best stock analysis tool depends on how you invest and what part of the research process matters most to you. Some investors prioritize discovering new ideas, others focus on deep financial analysis, while traders rely heavily on price charts and technical indicators.
Rather than looking for a single “perfect” platform, it helps to evaluate research tools based on a few key criteria.
1. Your investment strategy
The first factor is how you analyze stocks.
- Long-term investors typically need financial statements, analyst estimates, and valuation tools. Platforms like Gainify, TIKR, or Fiscal.ai focus heavily on these datasets.
- Active traders rely more on charting tools, technical indicators, and alerts. Platforms such as TradingView or Finviz are designed for this workflow.
Your strategy should determine which tools matter most.
2. Screening and idea discovery
If you regularly search for new investment opportunities, a strong stock screener becomes essential.
Advanced screeners allow you to filter companies based on metrics such as:
- revenue and earnings growth
- operating margin development
- return on capital
- leverage levels
- valuation multiples
- analyst estimate revisions
Platforms with powerful screeners can quickly narrow thousands of companies into a manageable list of potential investments.
3. Financial data depth
Not all stock research platforms provide the same level of financial data quality or coverage.
Some tools offer only basic metrics, while others provide:
- multi-year financial histories
- forward analyst estimates
- segment-level company data
- operational KPIs
- valuation modeling tools
Investors conducting deeper fundamental analysis usually need platforms with institutional-quality financial datasets.
4. Workflow and usability
Another key factor is how well the platform fits into your research workflow. Even strong datasets lose value if the interface makes analysis slow or fragmented.
Some platforms require switching between separate dashboards for screening, financial statements, charts, and portfolio tracking. More integrated tools connect these steps, allowing investors to move directly from idea discovery to company analysis, valuation checks, and portfolio monitoring within the same environment.
Interface design also matters. Clear financial tables, customizable charts, and structured company pages help investors identify trends faster and reduce time spent navigating the platform.
5. Price versus functionality
Finally, consider the functionality-to-cost ratio. Many modern platforms provide powerful research tools at a fraction of the cost of professional financial terminals.
Some investors are well served by free platforms for market monitoring, while others benefit from paid tools that provide deeper datasets, valuation frameworks, or AI-assisted analysis.
Try Gainify Free Today
With no financial commitment required, Gainify’s free tier offers the perfect opportunity to experience institutional-grade research tools enhanced by AI:
- Create a free account to access core features including AI-assisted analysis and global financial data.
- Start tracking your portfolio to monitor holdings, performance, and diversification in one place.
- Set valuation alerts to stay informed when price levels or valuation metrics reach your predefined targets.
- Screen global stocks using advanced filters to identify companies based on growth, profitability, and valuation metrics.
- Build custom charts to visualize financial metrics such as revenue growth, margins, and valuation trends alongside price performance.
- Ask the AI assistant your most important investment questions and analyze companies faster.
By starting with Gainify’s free tier, you can immediately elevate your research process and make more confident investment decisions
FAQs About Stock Research Platforms
What is the best free stock research app in 2026?
Several platforms offer strong free versions, but the depth of features varies significantly. Gainify provides one of the most comprehensive free plans, including access to AI-assisted stock analysis, a global stock screener, analyst estimates, and portfolio tracking without requiring a credit card. Yahoo Finance is another widely used free option, offering real-time quotes, price charts, and financial news, although many advanced research features remain locked behind its paid tiers.
How do AI-powered stock research tools work?
AI-powered stock research apps connect specialized AI models with financial datasets such as earnings transcripts, financial statements, analyst estimates, and market data. Investors can ask questions in natural language and quickly receive insights about companies, competitors, and financial trends without manually reviewing large volumes of data.
Many platforms extend this capability across the research workflow. Examples include AI stock screeners that identify companies meeting specific financial criteria, AI portfolio analyzers that assess diversification and risk exposure, and AI research assistants that summarize filings, earnings calls, or news. By automating parts of the analysis process, these tools help investors evaluate companies faster and focus on investment decisions rather than data collection.
Are paid stock research platforms worth the investment?
Yes, paid stock research platforms are worth the investment for serious investors. Premium services provide access to deeper analyst estimates, forward-looking data, proprietary metrics, and advanced AI capabilities that can significantly improve decision-making. The value comes from time saved on research and potential improvements in investment returns. Many platforms offer tiered pricing to match different investor needs and budgets.
Which stock research app has the most accurate analyst estimates?
Gainify offers the most comprehensive and transparent analyst estimate database available to retail investors, pulling data directly from S&P Global Intelligence. The platform shows historical accuracy of previous estimates versus actual results, giving crucial context for evaluating current projections. Other platforms with strong analyst coverage include TIKR and FactSet, though the latter comes at institutional-level pricing.
How do I choose between technical and fundamental analysis platforms?
Your investment timeframe and strategy should guide this choice. For long-term investors focused on company value and growth, fundamental analysis platforms like Gainify provide deeper insights into financial health and future potential. Short-term traders may prefer technical platforms like TradingView with advanced charting tools. Many investors use both types, with a fundamental platform for stock selection and a technical platform for timing entry/exit points.
What features should beginners look for in a stock research app?
Beginners should prioritize platforms with intuitive interfaces, educational resources, pre-built screeners, and clear visualizations. Look for tools that explain financial metrics directly in the interface (like hover tooltips), offer AI assistance for answering questions, and provide pre-built stock ideas rather than overwhelming with complex customization options. Gainify’s clean interface and AI assistant make it particularly beginner-friendly while still offering advanced capabilities.
Can stock research apps help with international investing?
Yes, several platforms offer robust international coverage. Gainify covers 150+ global exchanges, Simply Wall St provides data on 120,000+ stocks across 90 global markets, and TIKR covers 100,000+ stocks across 92 countries. When investing internationally, look for platforms that provide local market context, currency conversion tools, and region-specific metrics to account for different reporting standards.
How much do professional-grade stock research platforms cost?
Professional-grade platforms vary widely in price. Institutional platforms like Bloomberg Terminal ($32,000/year), FactSet ($45,000/year), and S&P Capital IQ (~$16,000+/year) are beyond most individual investors’ budgets. Retail-focused platforms with professional features range from Gainify ($9.92-$26.99/month), Koyfin ($39-$299/month), and TIKR ($17.95-$37.95/month), making institutional-quality research much more accessible.
Are mobile stock research apps as powerful as desktop versions?
Most leading stock research platforms offer responsive web applications rather than dedicated mobile apps. These web apps adapt to different screen sizes but may offer slightly different experiences between desktop and mobile. Complex tasks like custom screening and detailed chart analysis often work better on desktop, while monitoring portfolios, checking alerts, and reading news are well-suited for mobile. Gainify’s clean interface works well across both environments.
Which stock research app is best for tracking insider trading?
Gainify offers the most comprehensive and user-friendly tracking of both insider trades and Congressional trading activity, with real-time alerts, portfolio comparisons, and the ability to replicate trades to your own watchlist. FinViz also provides insider transaction data with visualization tools, while GuruFocus offers detailed insider tracking but at a higher price point.