Chart Any Financial Metric.
Data, Charted Your Way.
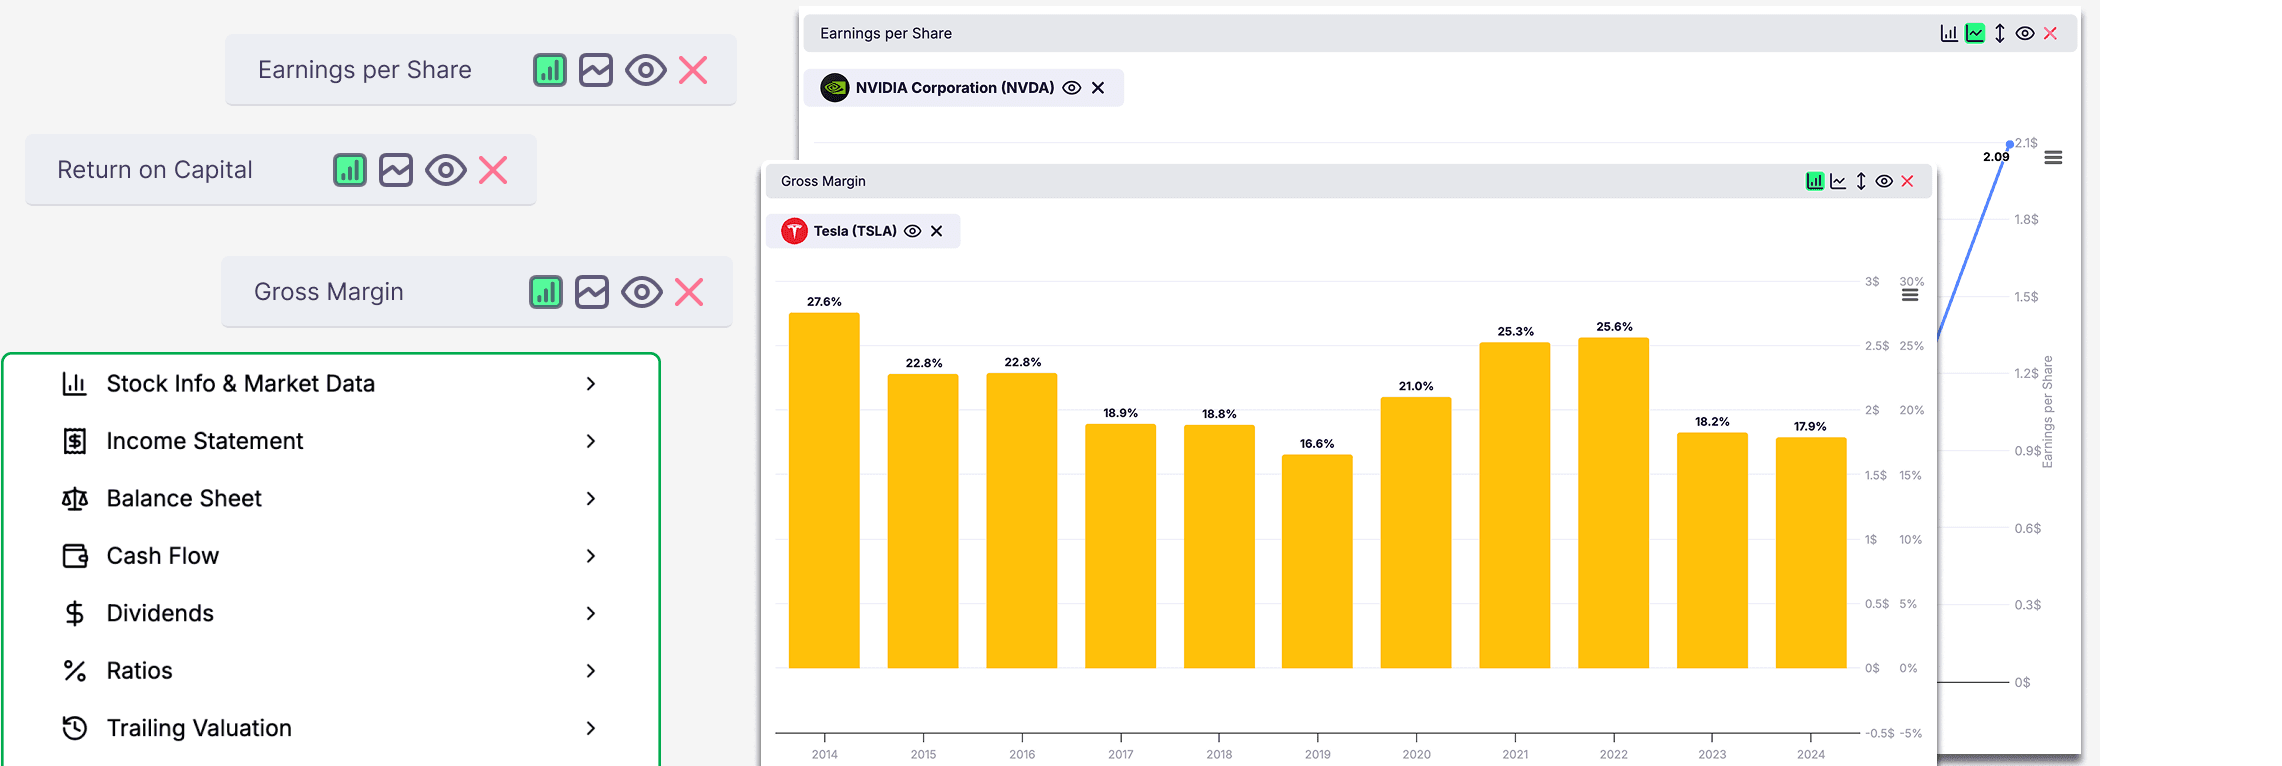
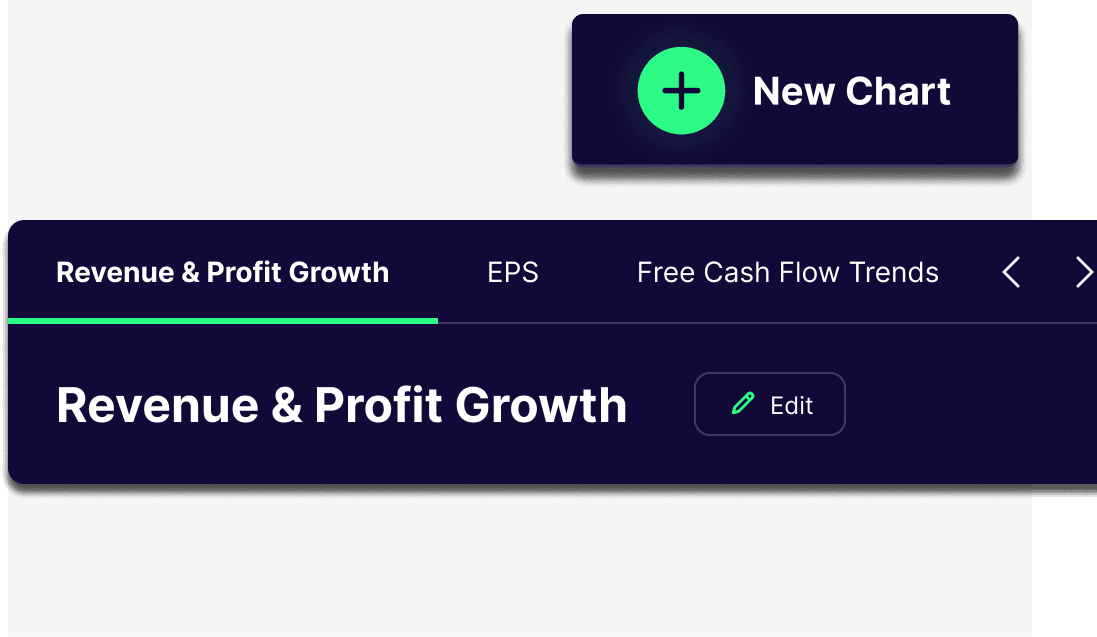
Pick a Metric, Plot a Chart
Explore over 500 financial metrics, powered by S&P Global data, and drop any into the chart, no formulas needed.
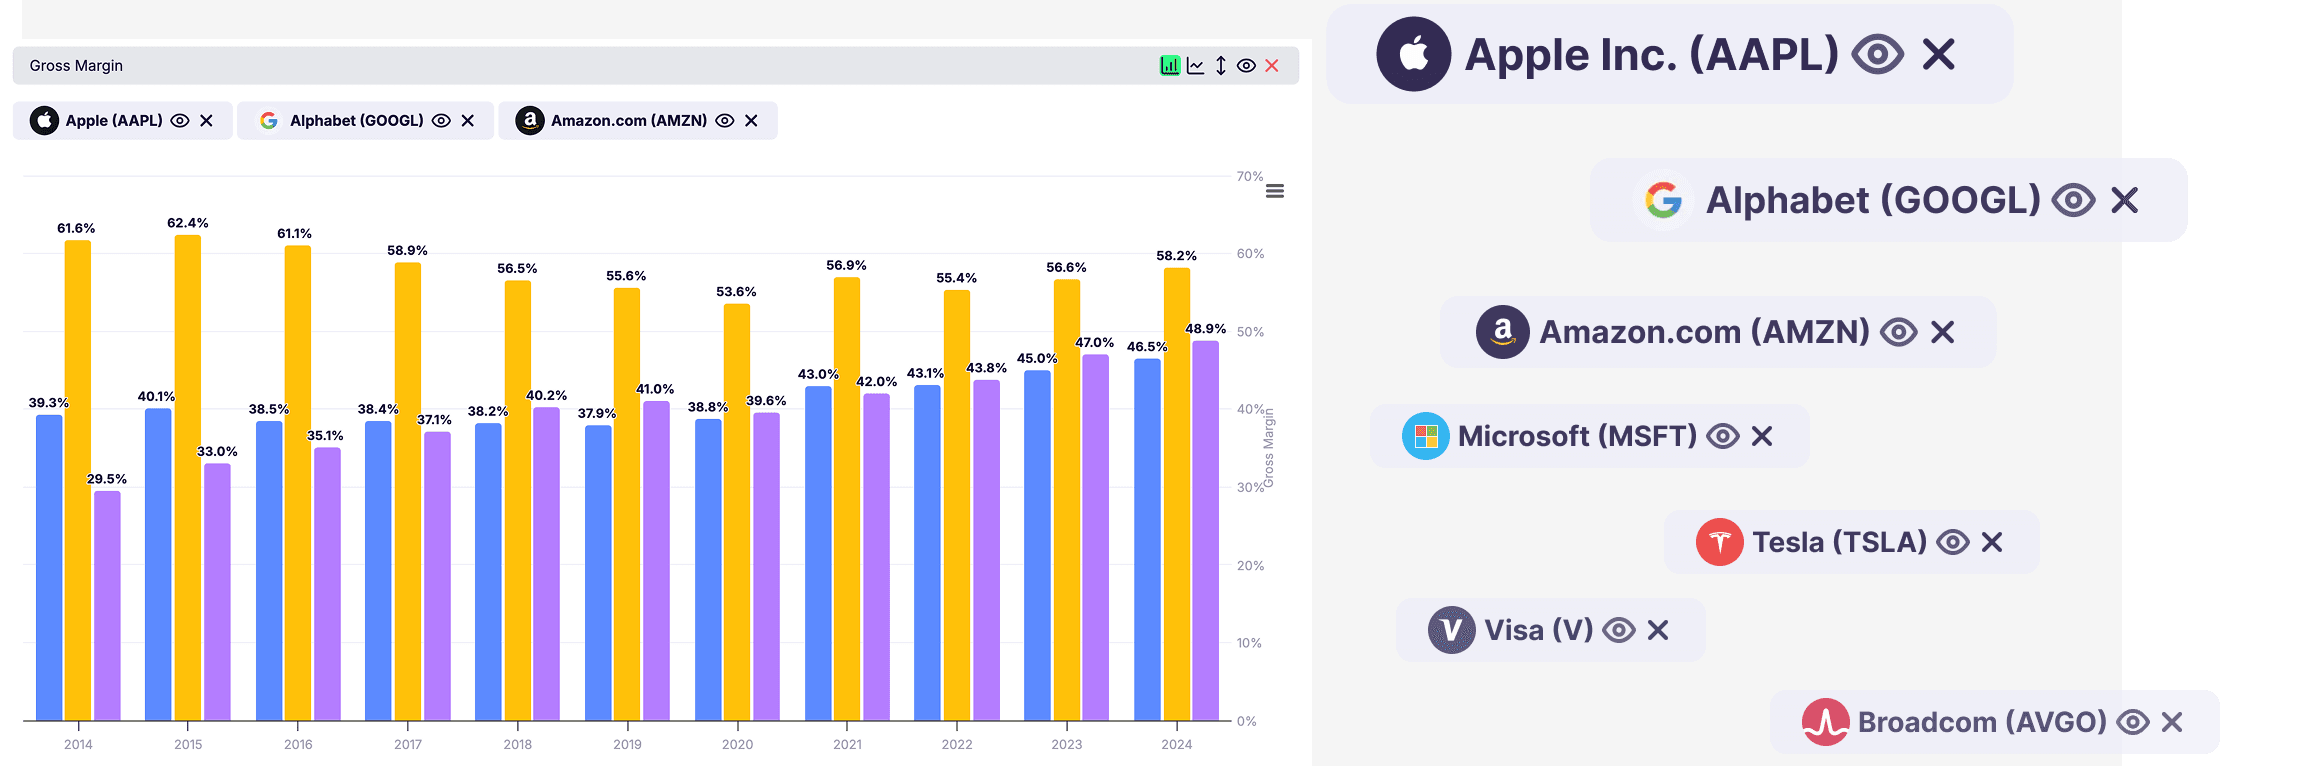
Compare Companies, Spot Trends
Overlay multiple tickers and track who's scaling faster, improving margins, or turning profitable.
Multi-Axis Support
Plot multiple financial metrics with different units or scales on separate axes for accurate, apples-to-apples insight.
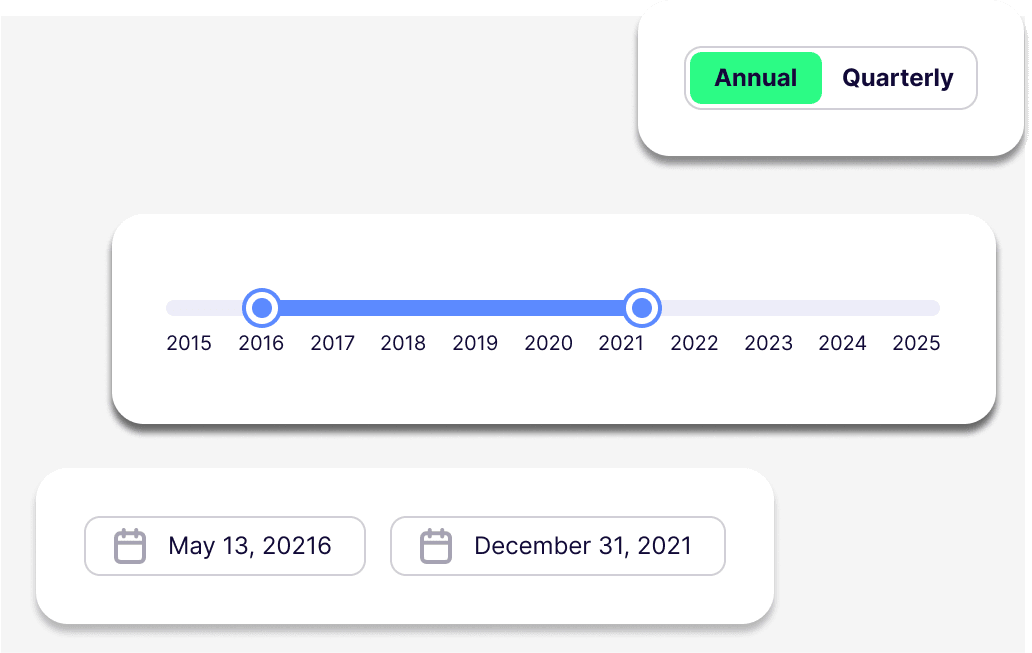
Smart Timeline Controls
Zoom into quarters or expand to decades. Switch between timeframes to explore trends on your terms.
Unlimited Chart Boards
Create as many custom dashboards as you need. Organize by strategy, theme, or metric and switch between them instantly.
Tiny Touches. Big Clarity.
Export & Share
Download any chart as PNG and post your insight to reports or socials with a few clicks.
Estimates
Add Wall Street earnings forecasts, revenue projections, or forward valuation metrics to your charts. See how expectations compare to actual performance over time.
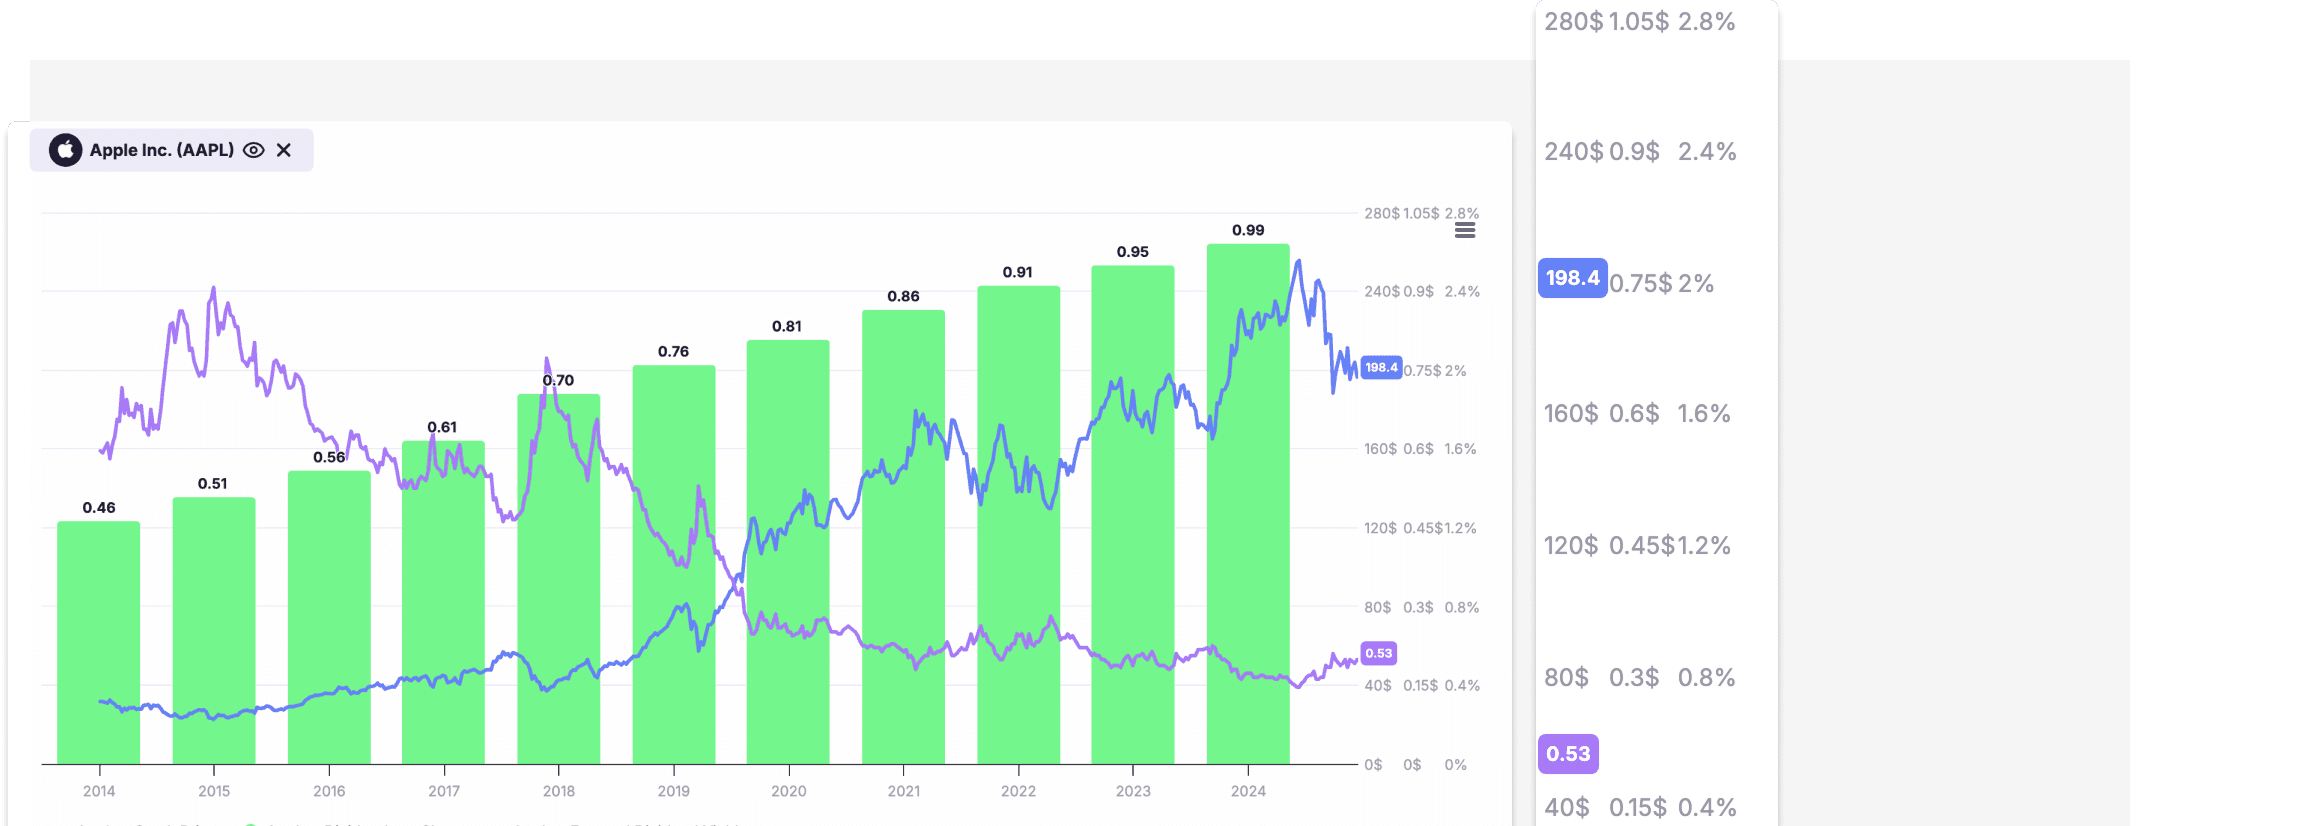
Intuitive Tooltips
Hover any data point to see the exact value, YoY %, and rolling CAGR for instant, clutter-free context.


NEWSLETTER
NEWSLETTER
Market data is sourced from S&P Global Market Intelligence. All insights and analysis are developed by Gainify. Copyright © 2026, S&P Global Market Intelligence. All rights reserved.
View Data ProvidersOur content is general in nature and does not account for your personal financial circumstances. Any investment decisions you make are your responsibility. We strongly recommend speaking with a licensed financial advisor or professional before acting on any information found on Gainify. Before using Gainify, please review our Terms of Service.