Get To Know Any Stock.
All Angles. One Stock.
Complete Company Snapshot
From financials to peers to company background, get everything you need to size up a stock in seconds.
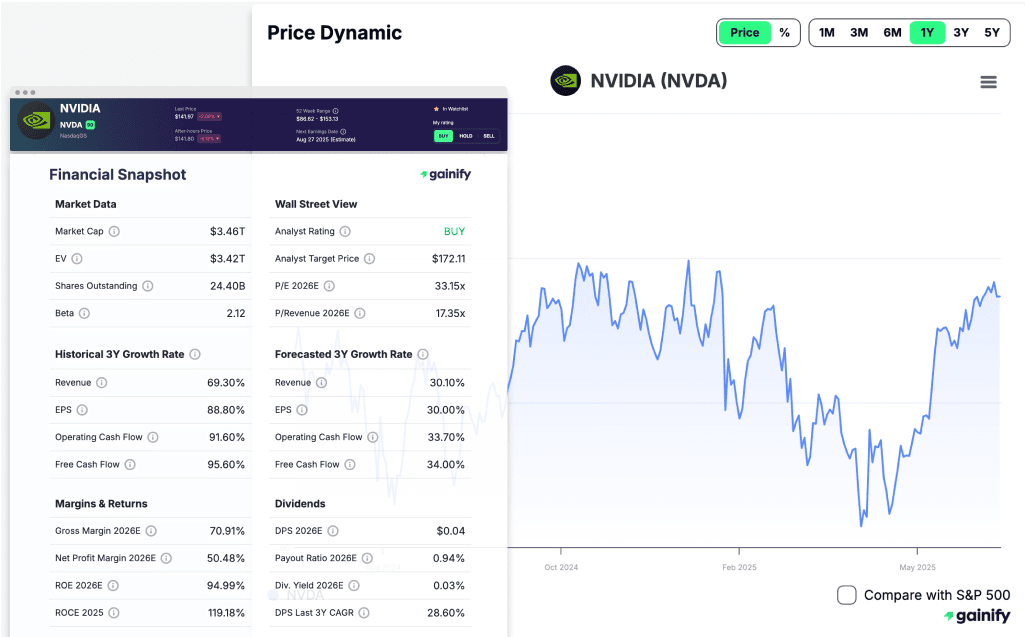
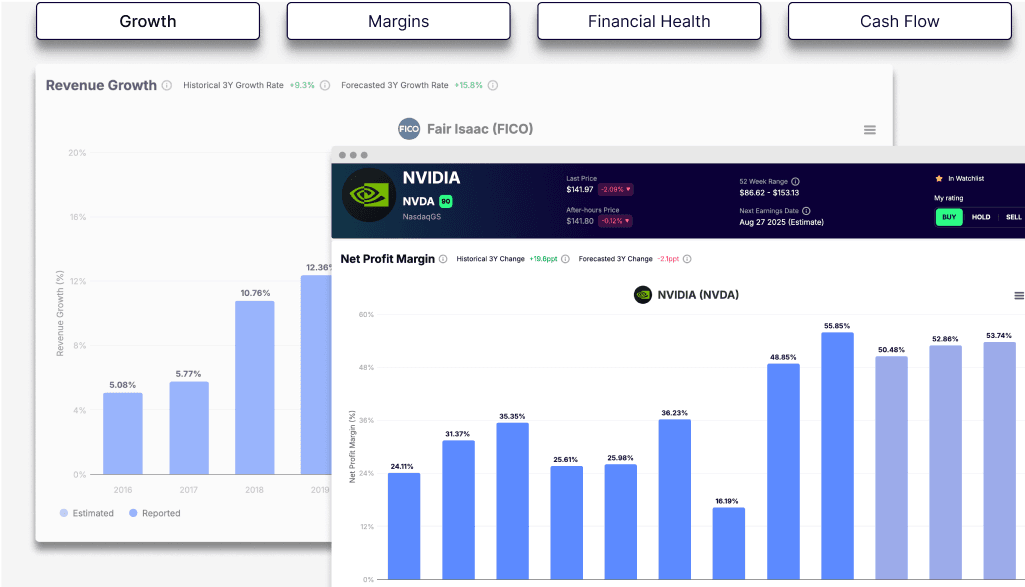
Key Financials
Review growth, margins, cash flow, and financial health with charts covering 10 years of history and 3 years of forecasts, all in one easy view.
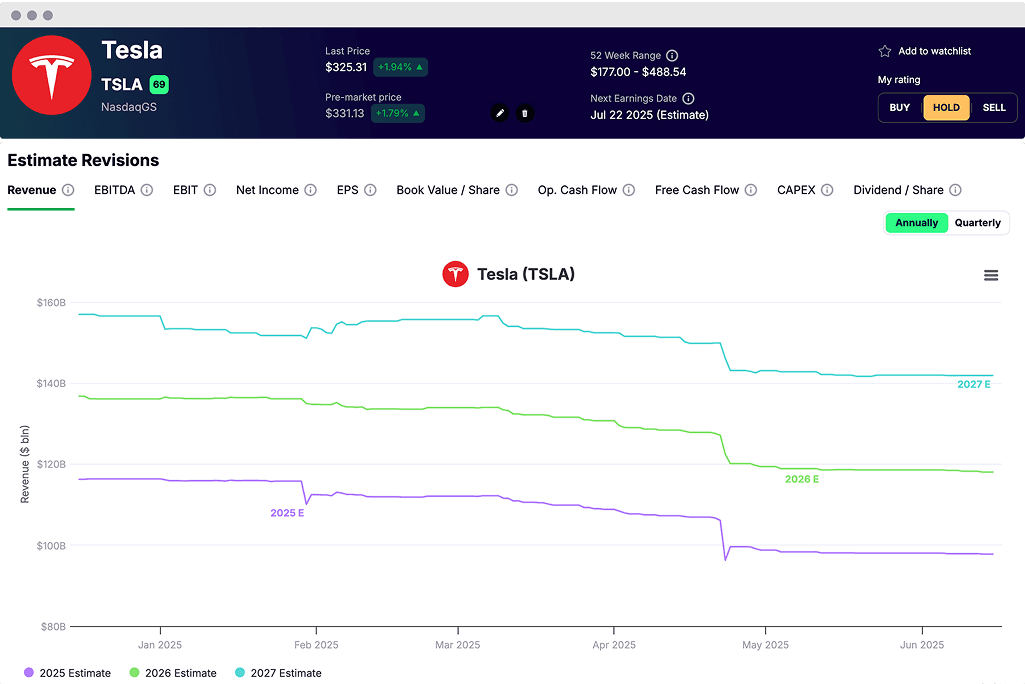
Wall Street Estimates
Access the most extensive database of analyst forecasts available to retail investors, including revenue and nine other key metrics, plus revision trends that highlight momentum.
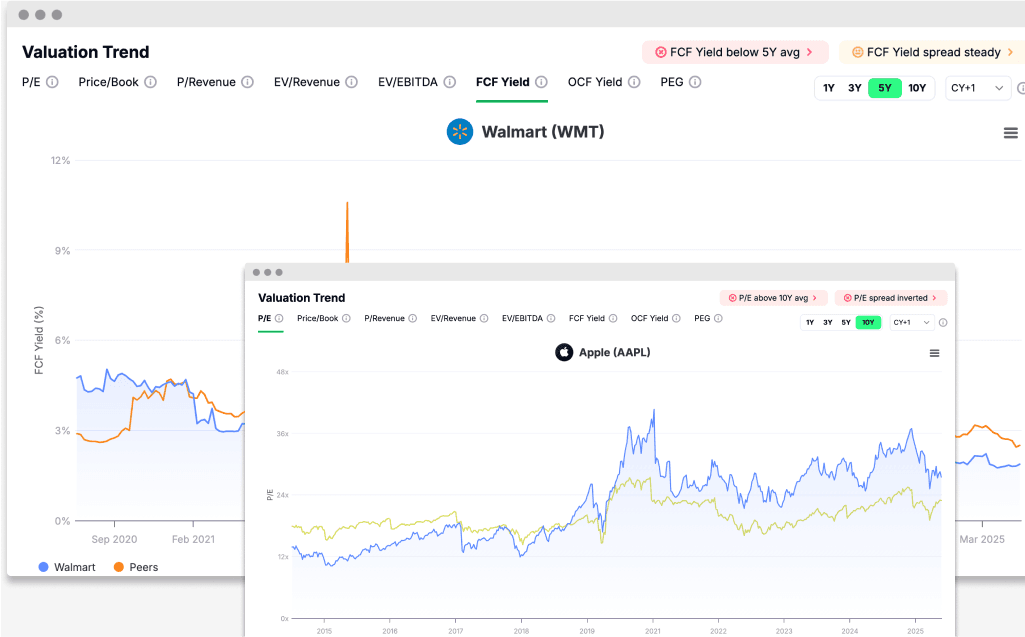
Valuation Deep Dive
Analyze forward valuation with rolling 10-year charts for Y+1 and Y+2 metrics. Includes P/E, EV/EBITDA, Price-to-Sales, and more to show how the market values each stock relative to its own history.
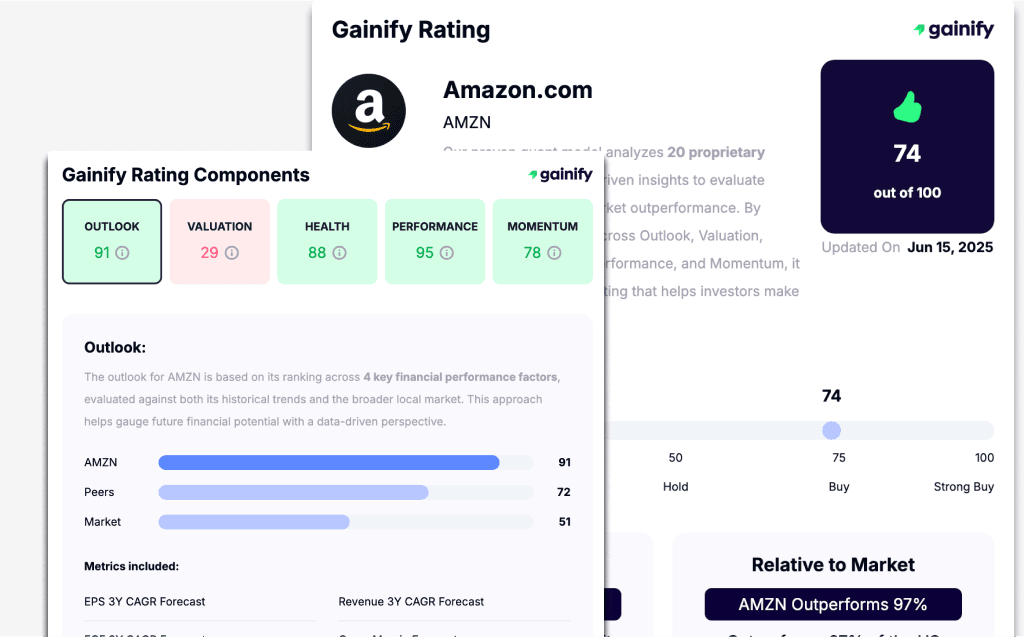
Gainify Rating
100+ data points distilled into a single score from 1 to 100. Built by finance experts to help you quickly assess quality and value.
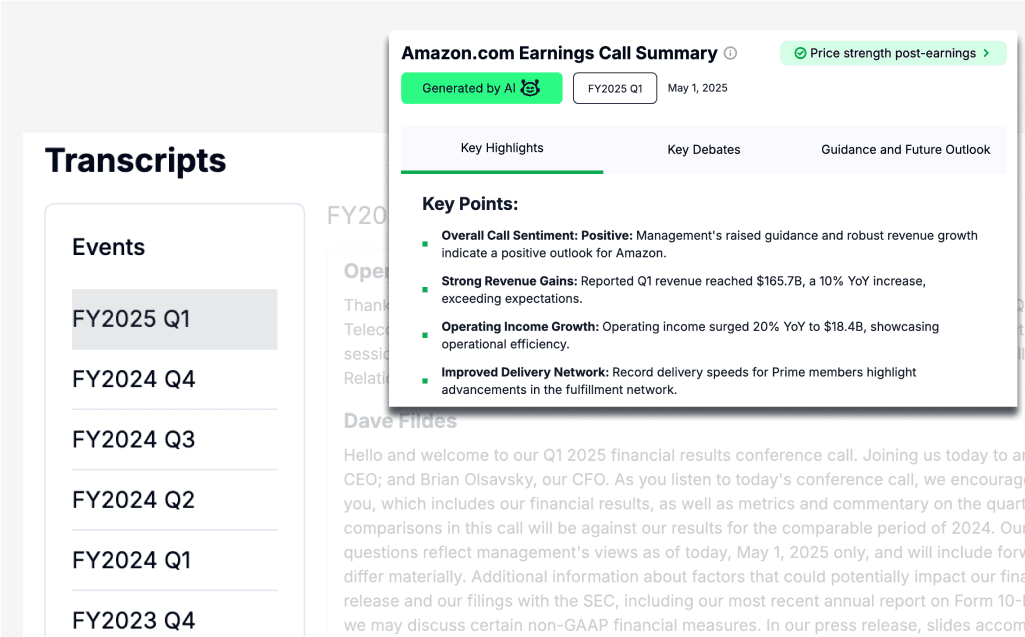
Investor Relations Hub
AI summarizes the latest earnings call, while transcript tabs let you explore full earnings call transcripts from recent years.
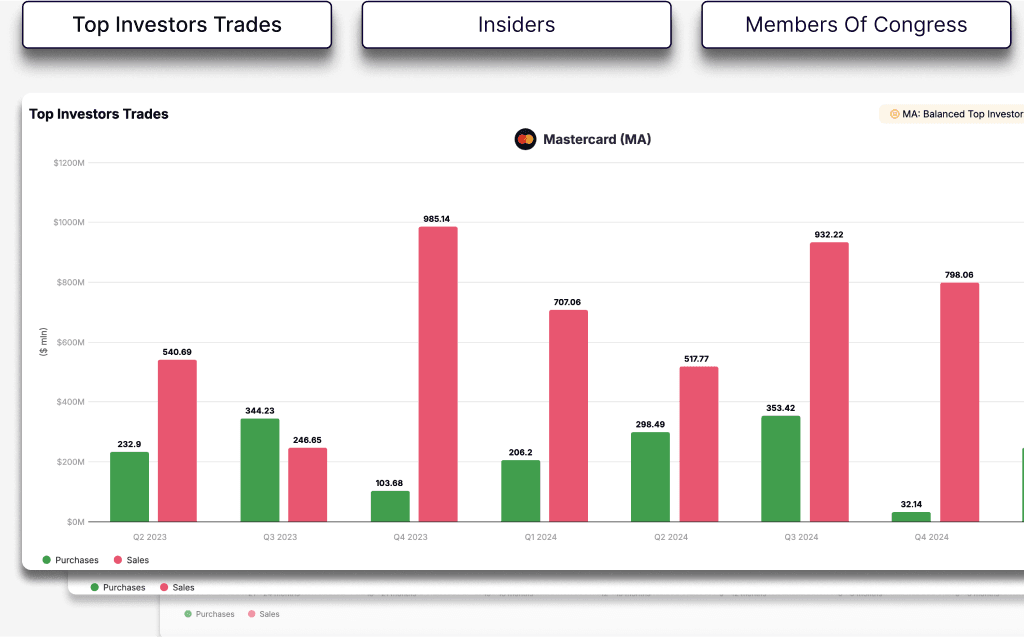
Ownership Lens
Spot top funds, insiders, and even Congressional holders, updated within minutes of each filing.
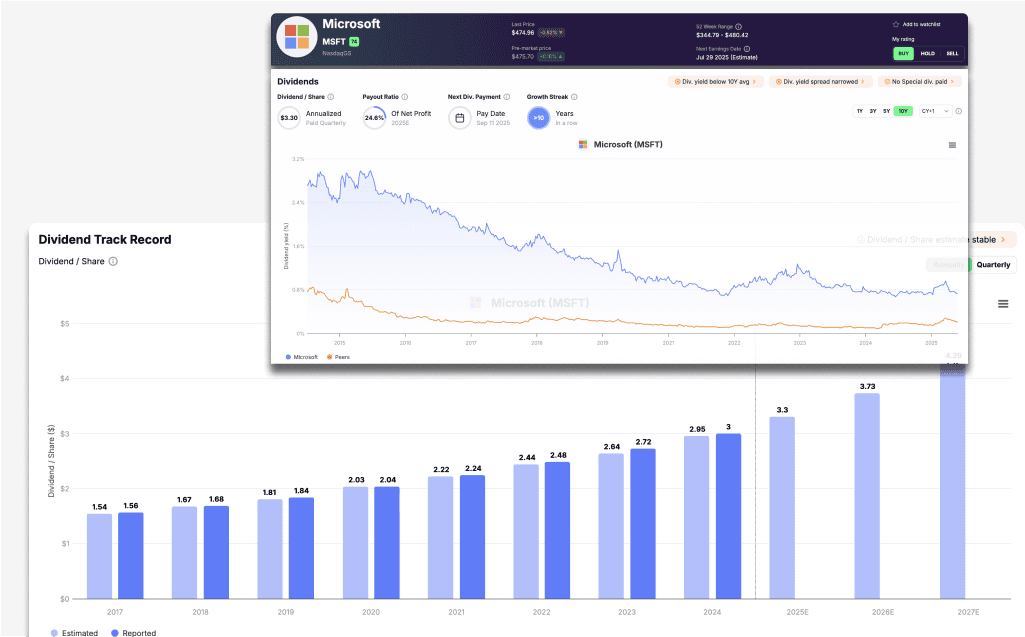
Dividend Snapshot
Track yield, payout ratio, next pay date, and dividend growth over time, all visualized in a single clear chart.
Small Features. Big Impact.
Annual / Quarter Toggle
Flip between yearly and quarterly views to view trends from any angle.
Your Own Rating
Mark the stock Buy, Hold, or Sell and track your call over time.
Financial Trend Tags
Each tag explains the chart in plain terms with context and comparisons.
Instant Chart Export
Download any chart in a click and share it with investor friends or on socials.
Estimate Revisions Tracker
See how analyst estimates evolve over time and reveal emerging trends.
Every Concept Explained
Unsure about a term? Just hover. Every key financial concept is defined.


NEWSLETTER
NEWSLETTER
Market data is sourced from S&P Global Market Intelligence. All insights and analysis are developed by Gainify. Copyright © 2026, S&P Global Market Intelligence. All rights reserved.
View Data ProvidersOur content is general in nature and does not account for your personal financial circumstances. Any investment decisions you make are your responsibility. We strongly recommend speaking with a licensed financial advisor or professional before acting on any information found on Gainify. Before using Gainify, please review our Terms of Service.