

Dividends represent more than just periodic cash payments. They are a reflection of a company’s financial stability, capital allocation strategy, and long-term commitment to shareholders. For investors focused on passive income, dividends play a critical role in portfolio performance.
Understanding how to calculate dividends is essential for evaluating income potential and dividend sustainability. This goes beyond applying a single formula. Investors must analyze key dividend metrics such as dividends per share (DPS), dividend yield, dividend payout ratio, and dividend growth, and interpret what these figures reveal about a company’s financial health.
In this guide, we break down the core concepts of dividend calculation with clear formulas, practical examples, and expert-level insights. You will learn:
- How to calculate Dividends per Share (DPS)
- What Dividend Yield really tells you
- How to analyze the Dividend Payout Ratio
- And what to look for when assessing dividend sustainability and growth
Let’s dive in.
What Are Dividends?
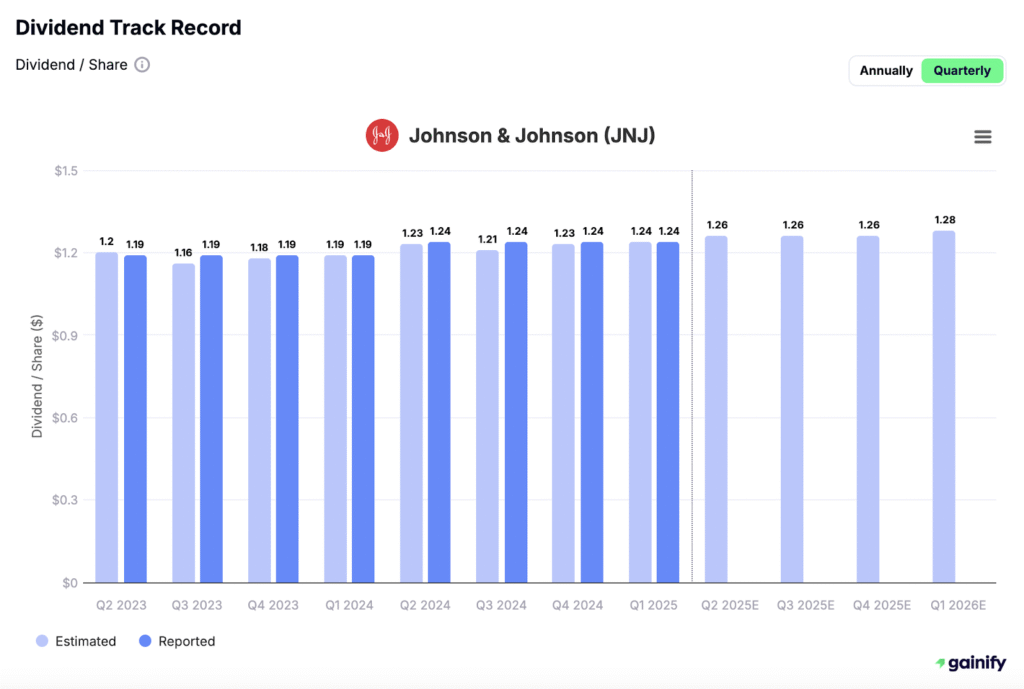
Dividends are distributions of a company’s earnings paid to shareholders, typically in the form of cash or additional stock. They are usually issued quarterly (quarterly dividends), although some companies pay them monthly or annually. Dividends provide investors with a share of the company’s profits and signal a company’s financial health and management’s confidence in future performance.
Dividends are especially important in income-focused investment strategies, including retirement portfolios and dividend growth investing. Reinvesting dividends can also significantly boost long-term total returns through compounding.
There are several types of dividends, each with unique characteristics:
- Cash Dividend Per Share: The most common form, paid directly to shareholders in cash. These are typically issued on a regular schedule (quarterly, semi-annually, or annually).
- Stock Dividend Per Share: Instead of cash, companies issue additional shares to shareholders. This increases the total number of outstanding shares owned but does not immediately increase total value.
- Special Dividend Per Share: One-time payments issued outside of the regular dividend schedule. They often occur after exceptionally strong earnings or asset sales.
- Preferred Dividend: These are fixed dividends paid to holders of preferred stock, often before any dividends are paid to common shareholders.
In this article, we will primarily focus on cash dividends, as they are the most common form of dividend distribution and most relevant to individual investors seeking reliable income streams.
Highlights
- Dividend calculation basics: Dividends are calculated by relating the cash paid to shareholders to the number of shares owned and the company’s financial performance
- Key dividend metrics: Dividend per share, dividend yield, payout ratio, and dividend growth explain how much income you receive and how reliable it is
- Dividend sustainability: Strong cash flow and healthy financials help determine whether a dividend can be maintained over time
- Yield requires context: A high dividend yield is not always a positive signal and should be evaluated alongside payout and cash flow metrics
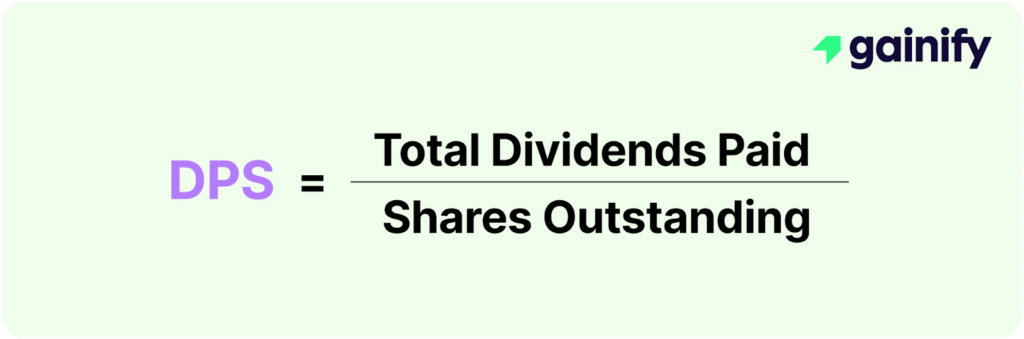
How to Calculate Dividends per Share (DPS)
Dividend per Share (DPS) measures the amount of cash a company distributes to shareholders for each outstanding share of common stock. It represents the most direct form of dividend income on a per-share basis and serves as the foundation for other dividend metrics.
Dividend per Share Formula
Dividend per Share = Total Dividends Paid ÷ Number of Outstanding Shares
Example: Dividend per Share Calculation
Assume a company pays $50 million in total dividends and has 25 million shares outstanding.
Dividend per Share = $50,000,000 ÷ 25,000,000 = $2.00
This means each share owned receives $2.00 in annual dividend income.
Why Dividend per Share Matters
Dividend per share allows investors to:
- Understand the cash income generated per share
- Compare dividend payments across companies with different share counts
- Track dividend growth over time on a consistent basis
A steadily rising DPS often reflects improving profitability and a shareholder-focused capital allocation strategy, while stagnant or declining DPS may signal financial pressure or shifting priorities.
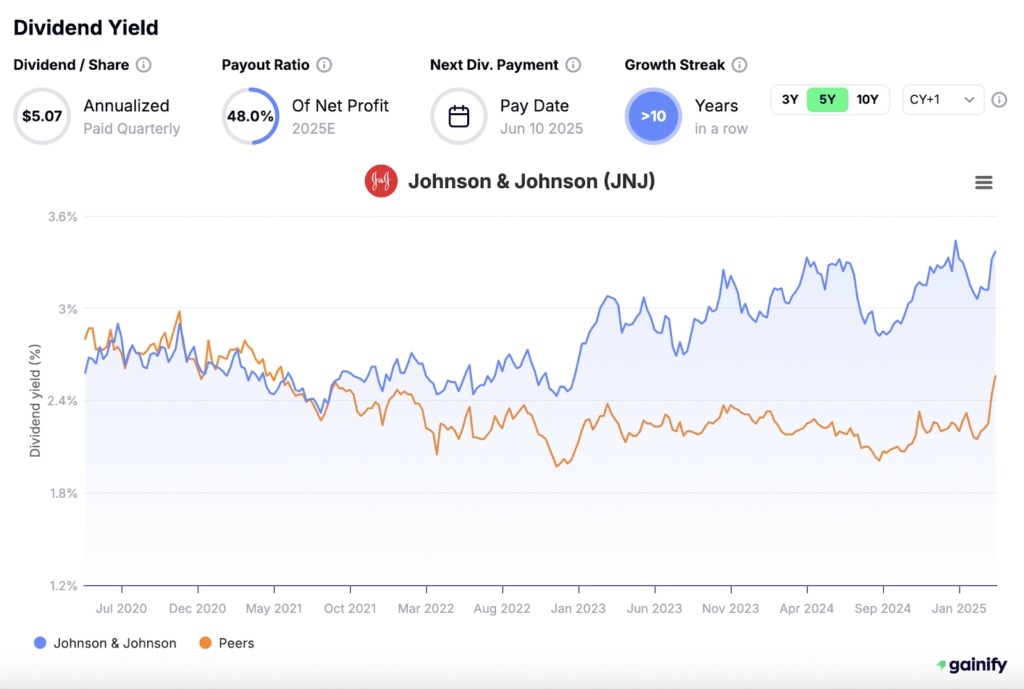
How to Calculate Dividend Yield
Dividend yield measures the annual dividend income an investor receives relative to the current share price. It expresses dividend income as a percentage and allows investors to compare income potential across different stocks.
Dividend yield is especially useful for income-focused investors, but it must be interpreted alongside other financial metrics to assess sustainability.
Dividend Yield Formula
Dividend Yield = Annual Dividend per Share ÷ Current Share Price

Example: Dividend Yield Calculation
Assume a company pays an annual dividend of $2.00 per share and its stock trades at $40 per share.
Dividend Yield = $2.00 ÷ $40 = 5%
This means the investor earns a 5% annual return from dividends alone, excluding price changes.
Why Dividend Yield Matters
Dividend yield helps investors:
- Compare dividend income across stocks with different prices
- Identify income-generating opportunities within a portfolio
- Assess how market price changes affect dividend returns
However, dividend yield should not be evaluated in isolation. An unusually high yield may reflect declining share prices or financial stress rather than strong dividend performance.
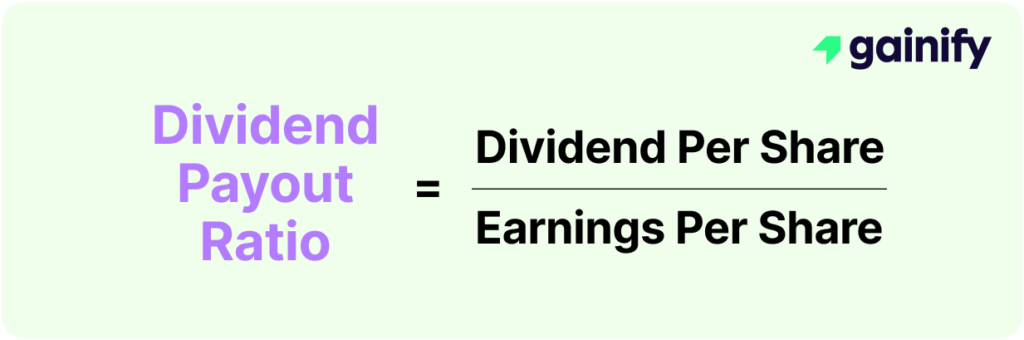
How to Calculate the Dividend Payout Ratio
The dividend payout ratio measures the percentage of a company’s net income that is distributed to shareholders as dividends. It shows how much profit is being returned to investors versus how much is retained for reinvestment, debt reduction, or reserves.
This metric helps investors assess whether a dividend level is reasonable relative to a company’s earnings.
Dividend Payout Ratio Formula
Dividend Payout Ratio = Dividend per Share ÷ Earnings per Share
Example: Dividend Payout Ratio Calculation
Assume a company reports:
- Dividend per share: $2.00
- Earnings per share: $4.00
Dividend Payout Ratio = $2.00 ÷ $4.00 = 50%
This means the company distributes 50% of its earnings to shareholders and retains the remaining 50% for other uses.
Why the Dividend Payout Ratio Matters
The dividend payout ratio helps investors:
- Evaluate whether dividend payments are supported by earnings
- Understand management’s balance between shareholder returns and reinvestment
- Identify dividends that may be vulnerable if earnings decline
Lower payout ratios generally offer greater flexibility, while very high payout ratios can signal limited room for dividend growth or increased risk during earnings downturns.
How to Evaluate Dividend Coverage Using Cash Flow
Cash flow coverage of dividends measures whether a company generates enough actual cash to fund its dividend payments. Since dividends are paid with cash rather than accounting profits, this metric provides a more reliable view of dividend sustainability than earnings-based ratios alone.
The most commonly used measure is the free cash flow payout ratio, which compares total dividends paid to free cash flow generated during the same period.
Free Cash Flow Coverage Ratio Formula
Free Cash Flow Coverage Ratio = Total Dividends Paid ÷ Free Cash Flow

Example: Cash Flow Coverage Calculation
Assume a company reports:
- Free cash flow: $800 million
- Total dividends paid: $400 million
Free Cash Flow Payout Ratio =
$400 million ÷ $800 million = 50%
This indicates that half of the company’s discretionary cash flow is used to fund dividends, leaving the remainder available for reinvestment, debt reduction, or reserves.
Why Free Cash Flow Coverage Matters
Cash flow coverage helps investors:
- Confirm that dividends are funded by operating cash generation
- Identify companies relying on borrowing or asset sales to maintain dividends
- Assess dividend resilience during economic downturns
As a general guideline, a free cash flow payout ratio below 75% is often considered sustainable, while ratios consistently above 100% may signal elevated dividend risk.
How to Assess Whether a Dividend Is Sustainable
Dividend sustainability refers to a company’s ability to maintain and grow its dividend over time without putting financial strain on the business. Calculating dividend metrics is only the first step. The real value comes from interpreting them together.
Below is a clear framework for evaluating dividend sustainability using the metrics you have already calculated.
1. Start With the Dividend Payout Ratio
Why it matters:
The payout ratio tells you what percentage of net income is being returned to shareholders. While useful, it must be interpreted alongside other metrics like FCF and coverage.
How to use it:
- A ratio under 60% is generally considered healthy.
Higher ratios may be acceptable in stable, cash-generating sectors (e.g., utilities, REITs), but could be a concern elsewhere.
2. Confirm Support From Free Cash Flow
Why it matters:
Dividends are paid in cash, not accounting profits. The Cash Flow Coverage Ratio shows whether the company is generating enough actual cash to fund its dividends.
How to use it:
- A ratio below 75% is generally sustainable.
- A ratio above 100% suggests the company may be borrowing or depleting reserves, putting the dividend at risk.
3. Review Dividend Growth History
Why it matters:
A stable or growing dividend is often a sign of strong fundamentals and shareholder-focused management.
How to use it:
- A 5–10% CAGR over a multi-year period is a strong signal of sustainable growth.
Look for consistent, moderate increases over time, rather than erratic or overly aggressive hikes.
4. Interpret Dividend Yield in Context
Why it matters:
Yield reflects dividend income potential relative to stock price, but a high yield may also reflect risk.
How to use it:
- Compare yield to industry peers and historical averages.
- Validate the yield using payout, FCF, and coverage ratios.
Interpretation tip:
A high yield accompanied by weak financial metrics could be a dividend trap.
5. Assess Balance Sheet Strength
Why it matters:
A strong balance sheet gives a company more flexibility to support dividends during downturns, credit tightening, or unexpected disruptions.
Key indicators include:
- Low debt-to-equity ratio, showing conservative leverage.
- Strong liquidity ratios (current ratio, quick ratio), supporting near-term obligations.
- High interest coverage, ensuring that debt service does not crowd out dividend payments.
Companies with healthy financial positions are less likely to reduce dividends in economic stress, and may even raise them opportunistically.
6. Evaluate Management’s Track Record and Capital Discipline
Why it matters:
A company’s leadership plays a central role in dividend reliability. Management’s past behavior and communication style provide insight into how dividends are prioritized.
What to look for:
- A conservative, consistent approach to dividend increases.
- Stability during recessions or market downturns – did they maintain or grow dividends?
- Clear, transparent communication in earnings calls or annual reports regarding dividend policy and capital allocation.
Trustworthy management teams view dividends not just as a financial obligation, but as a strategic tool to reward long-term shareholders.
Key Dividend Dates Investors Should Know
Understanding dividend dates is essential for determining who is eligible to receive a dividend and when it will be paid. These dates are set by the company’s board of directors and apply to each dividend distribution.
Ex-Dividend Date
The ex-dividend date is the cutoff date that determines dividend eligibility. Investors who purchase the stock on or after this date are not entitled to receive the upcoming dividend. To qualify, the stock must be purchased before the ex-dividend date.
Record Date
The record date is the date on which the company reviews its shareholder records to determine which investors are eligible to receive the dividend. Only shareholders listed on the company’s books as of this date will receive the dividend payment.
Payment Date
The payment date is when the dividend is actually distributed to eligible shareholders, either as a cash payment or additional shares, depending on the dividend type.
Together, these dates clarify dividend eligibility, timing, and payment mechanics, helping investors avoid confusion when buying or selling dividend-paying stocks.
Where to Find Dividends in Financial Statements
Dividends are reported across multiple financial statements, each providing different context about dividend payments and sustainability. Knowing where to look helps investors verify dividend information and assess reliability.
Income Statement (Only for Context)
Dividends do not appear directly on the income statement. However, the income statement provides important context by showing net income, which indicates whether the company is generating sufficient profits to support dividend payments.
Cash Flow Statement (Dividends Paid)
Dividends paid are reported in the financing activities section of the cash flow statement. This is the most direct place to find the total cash distributed to shareholders during a period and is critical for evaluating dividend funding from actual cash flow.
Notes to Financial Statements
Additional details about dividend policy, payment schedules, preferred dividends, and changes to dividend commitments are often disclosed in the notes to the financial statements. These notes provide important clarification that may not be visible in the primary statements.
Reviewing all three sources together allows investors to confirm dividend amounts, understand funding sources, and assess long-term sustainability with greater confidence.
Conclusion
Understanding how to calculate and interpret dividend metrics is a cornerstone of smart, income-focused investing. But it’s not just about identifying the highest yield – true success lies in identifying companies with sustainable, growing dividends supported by strong fundamentals and disciplined financial management.
Use the metrics in this guide to evaluate not only how much you’ll earn today, but also how secure and scalable that income will be in the years to come. Over time, a strategic dividend approach can lead to greater stability, compounding growth, and long-term wealth.