
Investors, financial analysts, and business leaders in 2026 constantly seek reliable methods to evaluate investment performance and make informed decisions. One of the most effective tools for assessing the long-term growth potential of investment portfolios and business ventures is the Compound Annual Growth Rate (CAGR).
A good CAGR depends on your investment period, risk tolerance, and the specific asset class, but generally falls between 7% and 10%, reflecting solid, sustainable returns that align with historical benchmarks like the S&P 500 index. For investors willing to accept higher risk, a CAGR above 10% signals strong growth potential and the possibility of above-average future returns.
In this guide, you’ll learn how to accurately calculate CAGR using the correct annual growth rate formula, assess its significance across different asset classes including mutual funds, stock market investments, and real estate and apply this powerful metric to make smarter, data-driven decisions for your investment strategy.
What Is CAGR?
CAGR, or Compound Annual Growth Rate, is a metric that describes the consistent annual growth rate of an investment or business metric over a specified time period, typically longer than one year. It provides a smoothed rate of return that eliminates the effects of volatility and short-term fluctuations.
In essence, CAGR answers the question: If your investment had grown at a steady rate every year, what would that rate be?
How to Calculate CAGR
CAGR offers a clearer picture of actual returns over a given time period, smoothing out the effects of market volatility, short-term fluctuations, and price volatility. It’s especially useful for evaluating mutual fund schemes, long-term investments, and assets with uneven intervals of returns.
Formula:
CAGR = (Ending Value / Beginning Value)^(1 / n) – 1
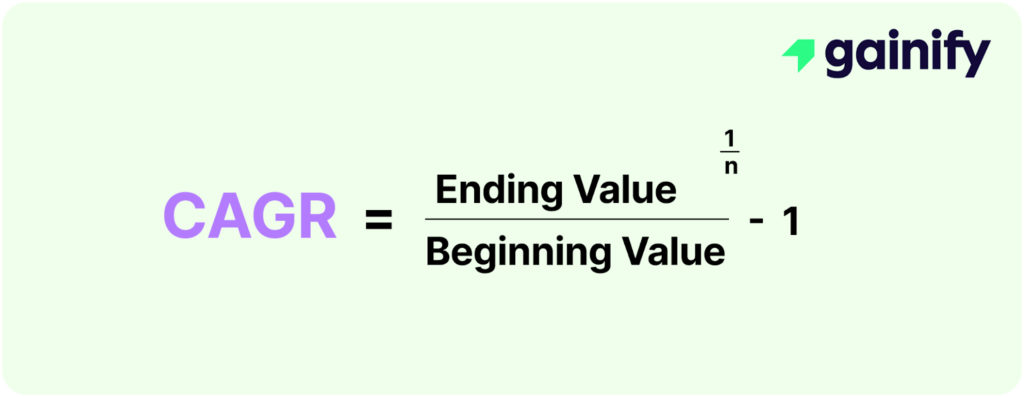
Where:
- n = Number of years in the investment period
- Beginning Value = Initial investment amount
- Ending Value = Final value of the investment
Example: If your initial investment was $10,000 and grew to $13,310 over a 3-year period, your CAGR would be exactly 10%. This represents a steady growth rate and consistent yearly returns throughout the holding period.
What Is Considered a Good CAGR?
CAGR can be used to measure the compounded annual growth of virtually any metric such as revenue, earnings per share (EPS), number of users, or even market share. However, it is most commonly applied to three key areas: stock market performance, business revenue growth, and EPS (earnings per share) growth. Understanding what constitutes a “good” CAGR in each context is essential for accurate analysis and realistic expectations.
1. CAGR in Stock Market Investing
A good CAGR for stocks is best understood in the context of long-term market benchmarks. Historically, the S&P 500 has produced an average compound annual growth rate of 7% to 10% after accounting for inflation, making this range a useful baseline for assessing investment performance.
According to Morningstar, a mutual fund or ETF consistently outperforming the market with a CAGR above 10% over a decade is exceptional. However, investors must weigh such returns against the volatility and risk taken to achieve them.
- Above 10% CAGR: Considered excellent, signaling market outperformance over time
- 7%–10% CAGR: Solid, in line with historical averages for broad market indices
- Below 5% CAGR: May indicate underperformance unless paired with extremely low risk or defensive characteristics (e.g., dividend stability)
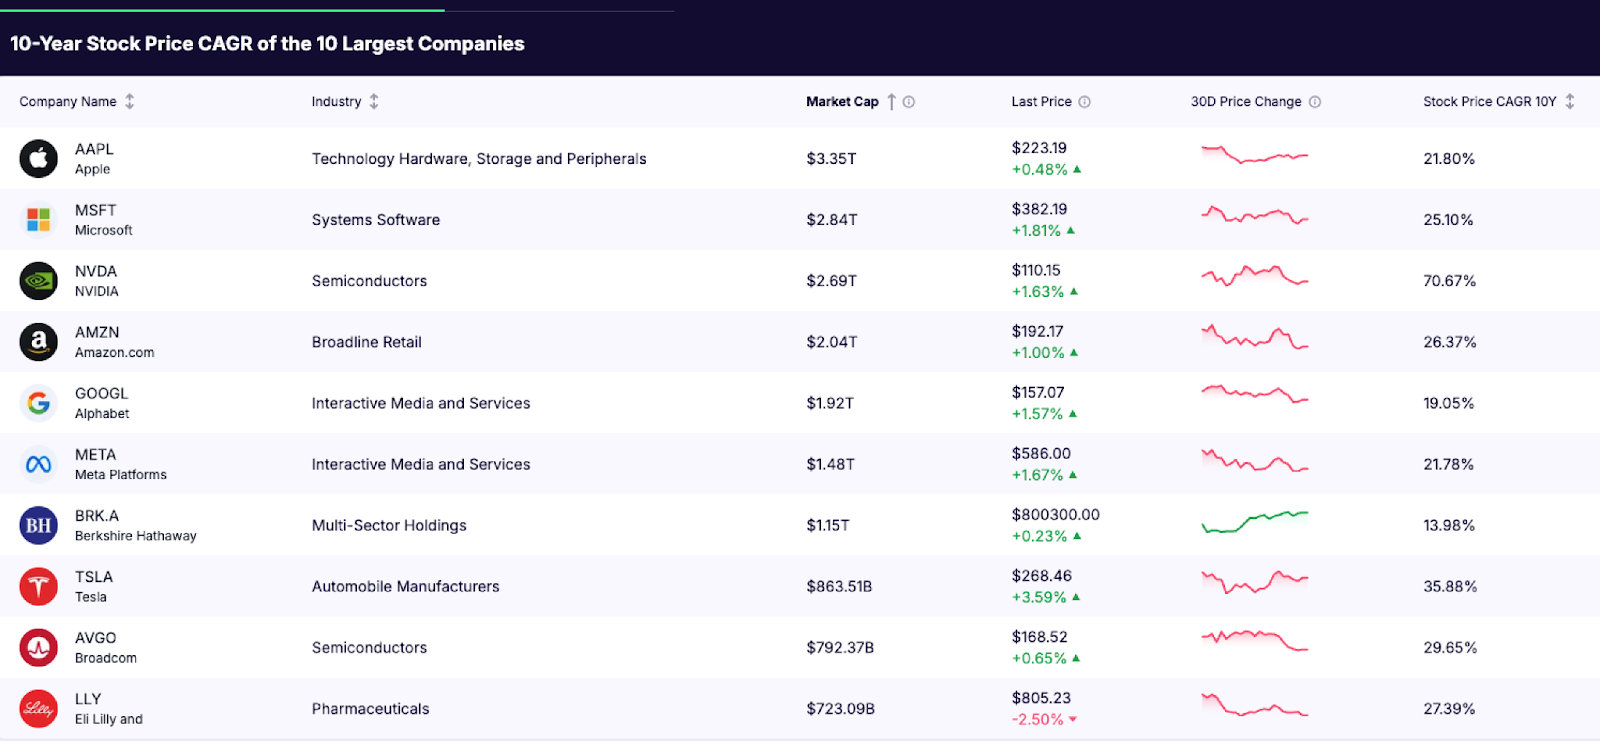
Example: Based on recent data, the 10-year stock price CAGR of the world’s largest companies underscores what exceptional growth looks like:
- NVIDIA (NVDA): 70.67% CAGR – a standout example of explosive growth in the semiconductor industry, driven by AI, gaming, and data center demand.
- Tesla (TSLA): 35.88% CAGR – fueled by innovation in EVs and energy solutions, despite volatility.
- Apple (AAPL): 21.80% CAGR – sustained by strong brand loyalty, product ecosystem, and consistent buybacks.
- Microsoft (MSFT): 25.10% CAGR – reflects strategic pivot to cloud and enterprise software.
- Amazon (AMZN): 26.37% CAGR – combining e-commerce dominance with AWS growth.
These figures highlight that while the historical average CAGR for the S&P 500 is 7%–10%, many leading companies have significantly outperformed this benchmark due to innovation, scale, and market leadership.
2. CAGR in Business Revenue Growth
In business metrics, such as revenue or customer growth, what counts as a good CAGR varies by company maturity:
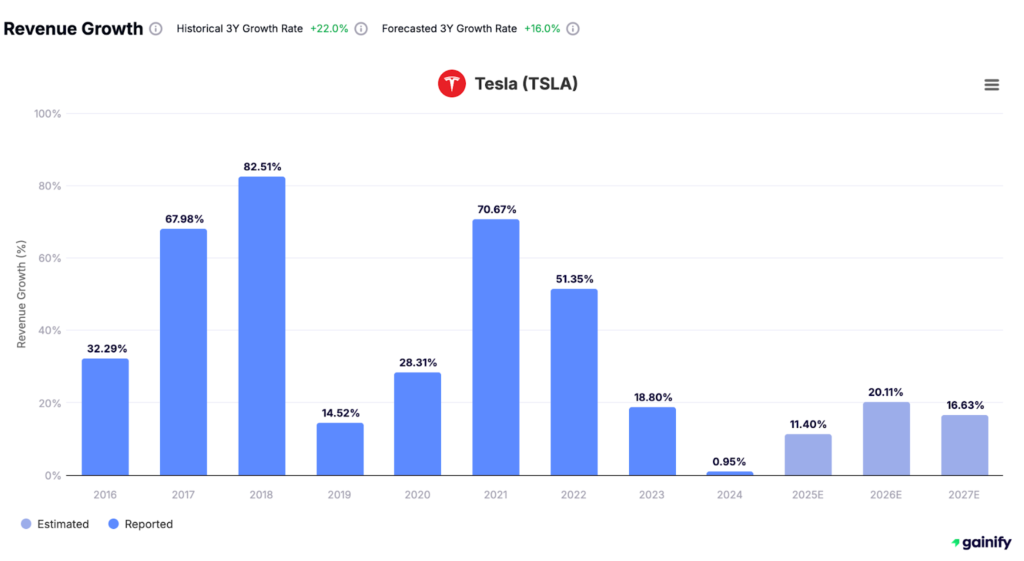
Startups / High-Growth Companies / Companies in High Growth Industries:
- 20%–50% CAGR is not uncommon in the early stages, especially in tech or SaaS.
- For example, Tesla grew its revenue at a CAGR of ~40% over the last 10 years.
Mid-Sized / Scaling Businesses:
- 15%–25% CAGR indicates healthy expansion.
- Companies like Atlassian maintained a 20%+ CAGR even after reaching multi-million-dollar revenue.
Mature Enterprises:
- 5%–10% CAGR is often considered strong, especially for large-cap, dividend-paying firms in stable sectors.
- Johnson & Johnson or Coca-Cola typically grow revenues at single-digit CAGR, reflecting consistency over rapid expansion.

3. CAGR in Different Sectors
When evaluating CAGR for a company, it’s important to adjust expectations based on the sector in which the business operates. Different industries exhibit different growth dynamics due to market maturity, competition, innovation cycles, and capital intensity. Below are typical ranges for revenue CAGR across major sectors:
CAGR expectations should also be adjusted based on industry norms:
- Technology & SaaS: Early-stage and high-growth tech companies often exhibit revenue CAGR of 20%–30% or more. These businesses scale quickly due to software-driven models and recurring revenue streams. For example, many cloud-based SaaS companies like Snowflake and Zoom exceeded 30% CAGR in their first several years.
- Consumer Goods: In mature markets, a 5%–10% revenue CAGR is considered solid. These businesses grow more slowly due to high market penetration and established competition but often offer stable cash flows and dividends.
- Energy / Utilities: Revenue CAGR of 3%–7% is typical, as these sectors are capital-intensive and highly regulated. However, many energy and utility firms compensate with high dividend yields and long-term infrastructure contracts.
- Healthcare / Biotech: Revenue CAGR varies widely. Startups and biotech firms can experience unpredictable but substantial growth upon FDA approvals or breakthroughs, while established pharmaceutical companies typically grow at 5%–10% annually.
Why CAGR Alone Isn’t Enough
While CAGR is a powerful indicator of long-term, compounded growth, it has important limitations. By its nature, CAGR smooths performance across time, assuming a constant rate of growth. However, real-world investments and business results are rarely so linear.
Here’s what CAGR does not reveal:
- Volatility or Risk: CAGR doesn’t account for the ups and downs that may have occurred along the way. Two investments may share the same CAGR, but one may have experienced wild swings while the other was relatively stable.
- Year-by-Year Variability: CAGR averages out annual growth and thus conceals fluctuations in individual years that could carry important implications for investors or operators.
- Market or Macroeconomic Context: A CAGR may look impressive in isolation, but loses meaning without considering inflation, interest rate trends, economic cycles, or competitive dynamics.
As Benjamin Graham famously said, “The essence of investment management is the management of risks, not the management of returns.” CAGR provides a valuable summary of returns over time, but it tells you nothing about the risk taken to achieve them. That’s why it should always be interpreted alongside other performance metrics for a more complete and responsible assessment.
Complementary Metrics to Consider:
While CAGR provides a single growth rate for assessing financial performance, it does not account for cash inflows, actual cash flow timing, or the volatile nature of investment returns. Relying solely on CAGR can hide critical factors like risk level, market conditions, and historical performance fluctuations.
Complement your CAGR analysis with these metrics:
- Standard Deviation: Measures volatility
- Sharpe Ratio: Assesses returns adjusted for risk
- Alpha and Beta: Benchmark comparisons
- Maximum Drawdown: Identifies worst performance over a historical period
Combining these metrics provides a more accurate picture of actual performance and helps achieve your financial goals through more precise investment analysis.
How to Use CAGR Effectively
To extract meaningful insights from CAGR, use it as part of a broader analytical framework:
- Compare Investment Options on a Risk-Adjusted Basis: Use CAGR alongside volatility measures to evaluate whether higher returns are worth the risk.
- Benchmark Against Market Indices: Judge performance relative to benchmarks like the S&P 500 or Nasdaq to contextualize growth.
- Apply in Business and Financial Planning: Use CAGR to project future revenues, profits, or asset growth in financial models.
- Analyze Historical Performance with Context: Interpret CAGR in light of the company’s strategy, economic cycle, or product lifecycle stage.
Final Thoughts
A good CAGR ultimately depends on your financial goals, risk profiles, and time horizon. For long-term investors, a steady average rate of return between 7% and 10% can build significant wealth through investment over time. For those pursuing aggressive growth trajectories, higher CAGRs may signal lucrative opportunities but require careful consideration of investment risk and market dynamics.
Remember, CAGR is a powerful tool but works best when combined with a thorough understanding of investment strategies, market trends, and the performance of investments over multiple time intervals. Use CAGR to gain a clearer picture of investment growth, but always factor in real-world challenges like price volatility, irregular cash flows, and evolving market conditions to make well-informed, responsible decisions.