
The best stock screeners scan a defined universe of stocks using your selected financial parameters and return a focused list of companies that match your criteria. In my investing process, I use screeners to cut thousands of global stocks down to a focused group worth deeper analysis. The filters that have generated the most value for me focus on reasonable forward valuation, strong long-term earnings growth, sufficient market capitalization, targeted sector exposure, and consistently high return on capital.
Choosing the right free stock screener is harder than it looks because the usefulness of free tiers varies dramatically. In my experience, the biggest differences are how a platform restricts data access, features, or screening flexibility. If you run the same screen on two “free” tools, you can get two very different stock lists because one platform may use stale data, lock valuation filters, or cap the number of results you can view.
In this article, I focus specifically on free stock screener options, meaning platforms that allow you to build screens and review results without paying upfront. I compare the nine best free stock screeners for 2026 with a complete free-tier breakdown. I tested every screener on this list using the same screening workflows and based the conclusions on hands-on results.
Free Stock Screeners Comparison
Stock screener | Best for | Key free features | Main limitation of free tier | Market coverage |
|---|---|---|---|---|
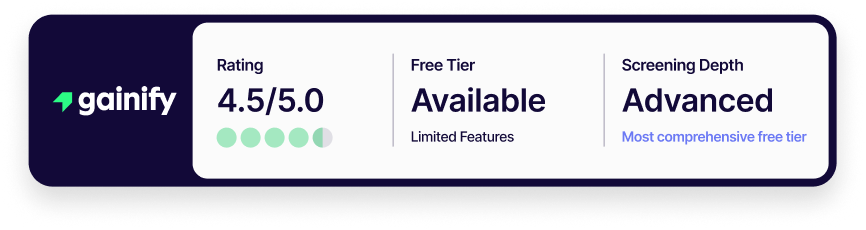
1. Gainify | Advanced, most comprehensive screening | 500+ screening parameters, forward estimates, AI-assisted discovery, unlimited saved screeners, customizable screens, institutional-grade accurate data | AI usage caps; additional advanced parameters and workflow extensions reserved for paid plans | Global stocks (85,000+ across 153 exchanges, 95 countries) |
2. TradingView | Technical and multi-asset screening | 200+ filters, integrated charting, customizable columns, multi-asset coverage, no registration | Trailing data only, no auto-refresh, chart and alert limits, delayed prices, ads | Global stocks, ETFs, crypto, futures (150+ exchanges) |
3. Finviz | Fast technical scans | <100 filters, strong technical patterns, heat maps, instant access | No forward data, no custom metrics, limited fundamentals, delayed prices | U.S. stocks only (~10,900) |
4. Yahoo Finance | Quick market snapshots | Basic filters, predefined screeners, heat maps, ESG visibility, customizable columns, no registration | Limited metrics, no quarterly or forward data, trailing valuation only, and very limited global stock coverage. | Global stocks (~5,700) |
5. Stock Analysis | Intermediate screening | ~280 filters, customizable columns, real-time data, multiple views | Cannot save screeners, heavy ads, timeframe ambiguity, limited history | Global stocks (~30,000) |
6. Koyfin | Institutional-style evaluation | Subset of professional metrics, dashboards, charts | Severely capped screeners and workflows, export disabled | U.S. stocks only (free tier) |
7. Seeking Alpha | Rating-driven fundamentals | Surface-level Quant Ratings, limited ratios | Meaningful screening locked; minimal filters; workflow gated | Global stocks (~24,000) |
8. WallStreetZen | Beginner idea browsing | Predefined screens, basic trailing metrics, DD pass/fail | Ratings locked, no customization or saving, heavy ads | U.S. stocks only (~5,400) |
9. Simply Wall St | Visual-first discovery | 200+ predefined screens, snowflake framework, basic filters | No custom logic, limited filters, mainly trailing data, fixed outputs | Global stocks (~54,500) |
When you look at the table as a whole, it becomes clear that best free stock screener apps are built with very different priorities in mind. Each platform solves a specific problem, and the differences in scope, depth, and usability show up quickly once you start using them.
- Entry-level platforms, such as Yahoo Finance, are designed for accessibility. They are useful for quick market checks, popular stock lists, and simple filters, but the metric set is narrow and mostly limited to trailing data, with no clear indication of how accurate or up to date the data is. These screeners work well for orientation and basic discovery. However, they still offer customizable screens that allow users to filter stocks based on basic financial and performance metrics. These screeners work well for orientation and basic discovery.
- Technical-first screeners, including Finviz and TradingView, focus on price action and visual analysis. They shine when scanning for momentum, chart patterns, and short-term setups. On the free tier, though, fundamental depth, forward-looking data, and saved workflows are limited, which makes them better suited for tactical analysis than long-term screening.
- Professional-grade platforms, like Koyfin, operate close to institutional research systems (but at a much cheaper price than traditional financial terminals). They offer deep datasets, long financial histories, and sophisticated analytical tools. However, free access is heavily constrained, and the screener mainly serves as a way to evaluate the platform rather than run ongoing research.
Across all of these categories, Gainify stands out as the most complete option. It brings together global equity coverage, institutional-grade data, forward-looking analyst estimates, and AI-assisted discovery in one place. Unlike most competitors, it does not restrict core screening logic or saved workflows on the free tier. That makes it viable for repeatable, multi-factor research at scale.
That distinction reflects a broader divide in how a stock screener is built. Many tools treat screening as a quick filtering step, separate from deeper analysis. Others integrate screening directly into a structured research workflow. Gainify fits into the latter category, where filtering, forward data, and ongoing evaluation operate within the same system rather than as disconnected tasks.
1. Gainify
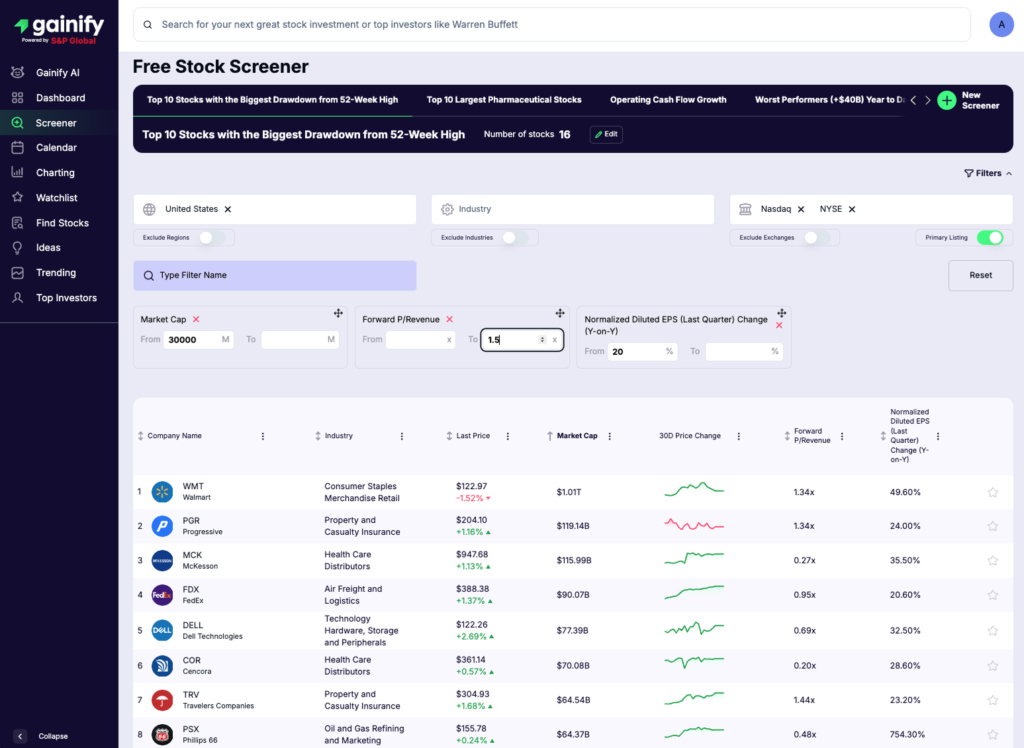
Gainify is an advanced free stock screener built around global equity coverage, institutional-grade datasets, forward-looking analysis, and customizable screens. In practice, the free screener enables investors to filter equities across financial fundamentals, valuation multiples, forward analyst estimates, growth and quality factors, and price-based momentum indicators within a single, unified workflow.
What differentiates Gainify is scale and data depth. It covers 85,000+ stocks (including secondary listings) across 153 exchanges in 95 countries, with 500+ screening parameters available directly in the free screener. These filters are backed by institutional-quality datasets rather than simplified retail metrics.
In addition to traditional screening, Gainify integrates AI-assisted discovery, allowing users to surface stocks by describing specific investment criteria in natural language. In my testing, no other platform I reviewed offers this combination of parameter depth, global coverage, institutional data, forward estimates, and AI-driven screening without restricting core screening functionality.
Best for
Gainify is best for investors who need advanced, forward-looking screening at global scale, with deep data coverage and AI-assisted discovery.
Based on my testing, it is most suitable for the following use cases.
- Multi-factor strategies that depend on consistent, structured evaluation across multiple dimensions of company performance.
- AI-supported research, where natural-language queries help surface stocks that match complex criteria without manually building every filter.
- Estimate-driven value investing, relying on forward earnings, revenue projections, and analyst revisions rather than trailing-only data.
- Global equity research across primary and secondary listings, not limited to U.S. markets.
- Repeatable workflows, where screens are saved, refined, and reused over time.
If your process depends on deep datasets, forward-looking metrics, and AI to accelerate idea generation, Gainify is built for that workflow.
Key free features
Gainify’s free tier functions as a complete screening environment with access to 500+ screening parameters at no cost, while additional parameters are available on paid plans. The free screener does not restrict geography or saved workflows. In practice, this allows investors to define, refine, and reuse complex, forward-looking screening logic using institutional-quality data without artificial limits disrupting the research process.
The core capabilities available on the free tier include:
- Global coverage at scale – Screen 85,000+ stocks, including primary and secondary listings, across 153 exchanges in 95 countries.
- Exceptional parameter depth – Access 500+ screening metrics spanning fundamentals, technicals, valuation, quality, growth, and risk factors.
- Ability to customize result columns – Select from over 500 available metrics to add precise, configurable columns tailored to specific analysis.
- Forward-looking screening – Filter using projected earnings, revenue growth, analyst revisions, and forward valuation multiples, rather than relying only on historical results.
- Institutional-grade data – Real-time S&P Global Market Intelligence data provides the same information institutional investors use.
- AI-assisted discovery – Use natural-language queries to surface stocks that meet specific investment criteria without manually configuring every filter.
- Unlimited saved screeners – Create, name, and reuse an unlimited number of custom screeners.
- Integrated research workflow – Move directly from screening into company analysis, ratings, watchlists, and charts within the same platform. Users can seamlessly connect screening outputs to a free stock portfolio tracker for real-time monitoring and performance attribution. Shortlisted ideas can also be organized inside a dedicated stock watchlist for structured tracking and review.
This structure removes the usual friction associated with free screeners. Screening is not interrupted by parameter limits, geographic restrictions, or lost work between sessions, which makes the free tier viable for serious, repeatable research rather than one-off exploration.
Main limitation of free tier
The free tier is intentionally open on data access and screening depth, but it draws limits around how far you can scale and automate your workflow.
- AI usage caps – AI-assisted screening and analysis are available, but the number of AI queries and deep analyses is limited on the free plan.
- Extended parameter access – An additional 500+ screening parameters are available for advanced users on paid plans, expanding coverage and specialization beyond the 500 parameters included for free.
- Workflow extensions – Some extended portfolio tools and deeper customization layers are available only after upgrading, even though core screening remains unrestricted.
In my testing, these constraints affect how extensively workflows can be scaled and augmented, but you can still build and save complex screens across a global universe using a full set of core parameters. The free tier mainly limits AI usage volume, access to extended parameters, and advanced workflow extensions, rather than restricting what data you can analyze.
2. TradingView
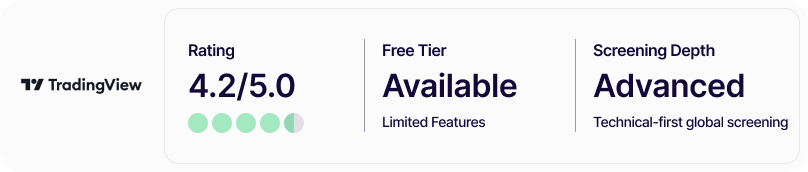
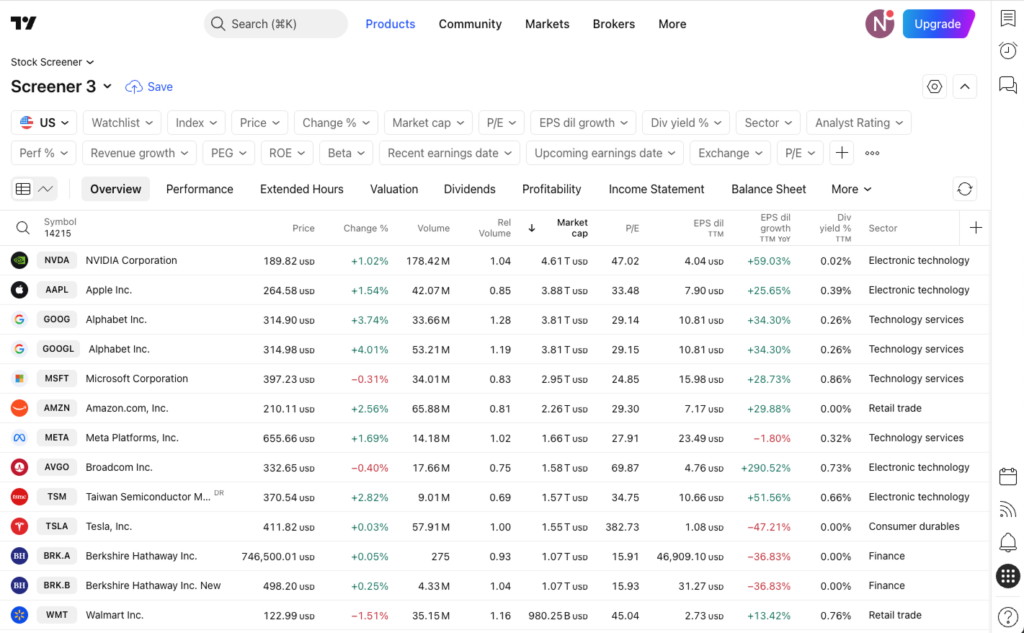
TradingView offers a globally focused stock screener tightly integrated with its charting and technical analysis environment. This evaluation looks strictly at the free stock screener (no credit card needed to start using the service). TradingView’s free screener filters assets using technical indicators and core fundamental metrics, then links results directly to interactive charts.
I tested the free screener directly and accessed it without registration. Screening transitions seamlessly into chart-based evaluation, allowing indicators, timeframes, and price action to be analyzed without leaving the interface.
TradingView’s free screener, in my experience, is most effective when used as a technical analysis tool with global market access. It performs well for identifying chart-driven setups but is less suited for deep, forward-looking fundamental research.
Best for
TradingView is best for technical and multi-asset screening with global market coverage.
From my testing, it works best for:
- Technical-focused day traders who rely on indicators, price action, and chart patterns.
- Global market users screening stocks beyond U.S.-only platforms.
- Multi-asset screeners working across stocks, ETFs, crypto, and futures.
Its value on the free tier is visual analysis and market breadth, not deep valuation modeling.
Key free features
The free tier includes the following capabilities.
- More than 200 fundamental and technical screening fields.
- Ability to customize columns, with over 200 available metrics shared between filters and outputs.
- Backward-looking financial data with quarterly, semiannual, annual, and TTM periods available.
- Integrated chart view for immediate technical analysis of screened results for day trading.
- Coverage across 150+ exchanges in more than 50 countries.
- Screening across multiple markets including stocks, ETFs, crypto, and derivatives.
- No registration required for basic screening access.
The ability to move instantly from screener to chart, in my experience, is TradingView’s defining free-tier advantage.
Main limitation of free tier
Based on testing of the free plan only, the limitations are clear and intentional.
- Trailing data focus – Financial metrics are mostly historical, with no estimates or forward valuation.
- No screener auto-refresh – Results do not update automatically.
- Output stagnation – Screening results lack deeper analytical summaries.
- Charting limits – One chart per tab and two indicators per chart.
- Saved layouts restricted – Only one chart layout can be saved.
- Delayed pricing – Market data is delayed by approximately 15 minutes.
- Advertising present – In-platform ads remain unless upgraded.
TradingView’s free screener is generous in scope but constrained in execution. It excels at discovering technically interesting setups across global markets, but deeper analysis, automation, and forward-looking valuation require paid plans.
Even so, I would choose TradingView’s free screener when technical analysis, chart integration, and international coverage matter more than fundamental depth or workflow automation and it remains a much cheaper alternative to the paid version.
3. Finviz
Finviz is one of the first widely adopted online stock screeners, originally launched in the mid-2000s. This review and testing focus strictly on Finviz’s free stock screener, not the Elite plan. Finviz is a U.S.-focused tool built for speed, visual scanning, and technical pattern filtering. In practical terms, the free screener filters equities using predefined valuation, financial, and technical criteria, with a strong emphasis on chart-based signals.
I tested the platform using the free trial version and accessed screening immediately without registration. I like how fast results load and how clearly technical filters are organized. However, the free tier’s limits materially shape what you can do with the tool.
In my opinion, Finviz’s free screener is designed for rapid market orientation rather than deep analysis or forward-looking research.
Best for
Finviz is best for technical screening and fast, pattern-based stock filtering using the free plan.
From my testing, it works best for:
- Active traders scanning price action, momentum, and chart patterns.
- Technical-first users relying on indicators such as RSI, moving averages, and breakouts.
- Visual users who prefer heat maps to quickly assess sector and market momentum.
Its strength on the free tier lies in speed and simplicity rather than deep analysis.
Key free features
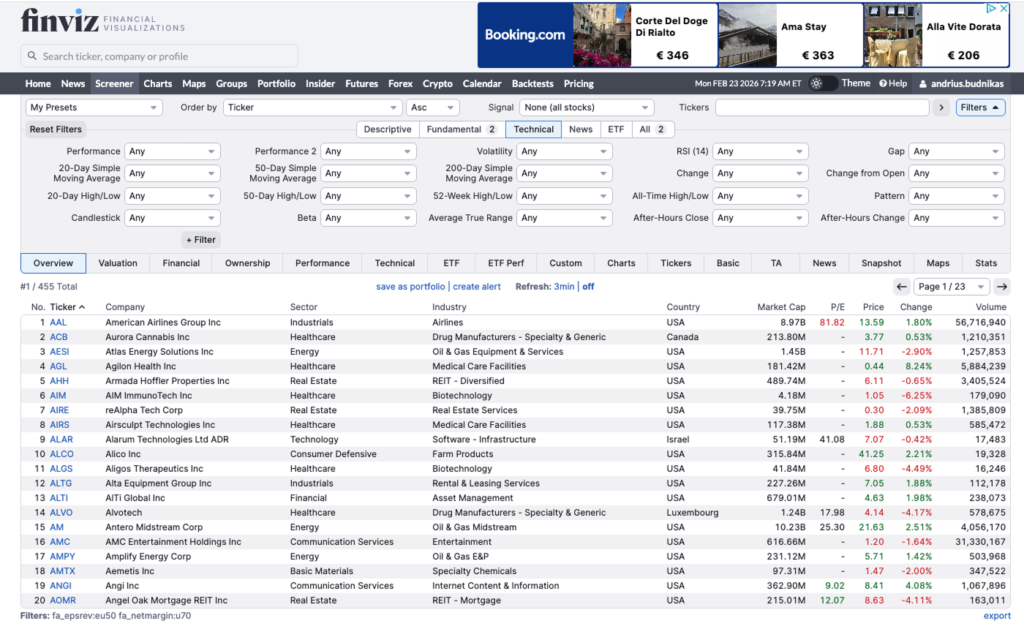
The free screener includes the following capabilities.
- Fewer than 100 screening filters covering valuation, financial ratios, and technical indicators.
- Predefined filter values only, with no custom metrics or formulas.
- Strong technical pattern filters for day trading.
- Heat map visualization for sector and market performance.
- Immediate access without registration.
- U.S. stock coverage of approximately 10,924 equities.
- Core financial metrics provided primarily in trailing format.
Finviz remains one of the fastest tools for identifying technical setups using a free screener.
Main limitation of free tier
Based on independent testing of the free plan only, the limitations are substantial.
- Limited filter count – Less than 100 total filters.
- No custom metrics – All filters use predefined values.
- Fundamental gaps – Several key fundamental metrics are missing.
- No forward-looking data – Financials are mostly trailing, with no estimates.
- Analyst metrics absent – Minimal consensus or forecast-based screening.
- U.S.-only coverage – No international equities available.
- Delayed pricing – 15-minute quote delay.
From my testing, the limited filter set is the most restrictive constraint. With fewer than 100 total filters and predefined values, the free screener cannot fully represent broad opportunity sets, which reduces effectiveness for sector-wide or multi-factor screening.
Even with these limitations, I would still choose Finviz’s free screener for fast, visual, technical market scans. It is not suited for fundamental analysis, valuation modeling, or forward-looking research, but it remains effective for rapid pattern-based screening.
4. Yahoo Finance

Yahoo Finance offers a free stock screener designed for immediate access and fast market scanning. The platform emphasizes simplicity and speed, allowing users to start screening without registration and quickly surface market movers, popular stocks, and broad sector trends. In my testing, the screener loads instantly and prioritizes ease of use over analytical depth.
Yahoo Finance works best for quick, time-sensitive checks, such as identifying the most active stocks, daily gainers and losers, or sectors drawing the most attention. I like how frictionless the experience is, but that same simplicity limits the screener’s usefulness for structured, repeatable research or multi-factor analysis.
Best for
Yahoo Finance is best for intermediate users and quick market checks that require no setup or registration.
I would choose Yahoo Finance for:
- First-time screening, to understand basic filtering and market structure.
- Market snapshots, such as daily gainers, losers, and most active stocks.
- Low-friction exploration, where speed matters more than precision or depth.
This positioning explains why the free screener focuses on accessibility and predefined views rather than advanced filtering or workflow tools.
Key free features
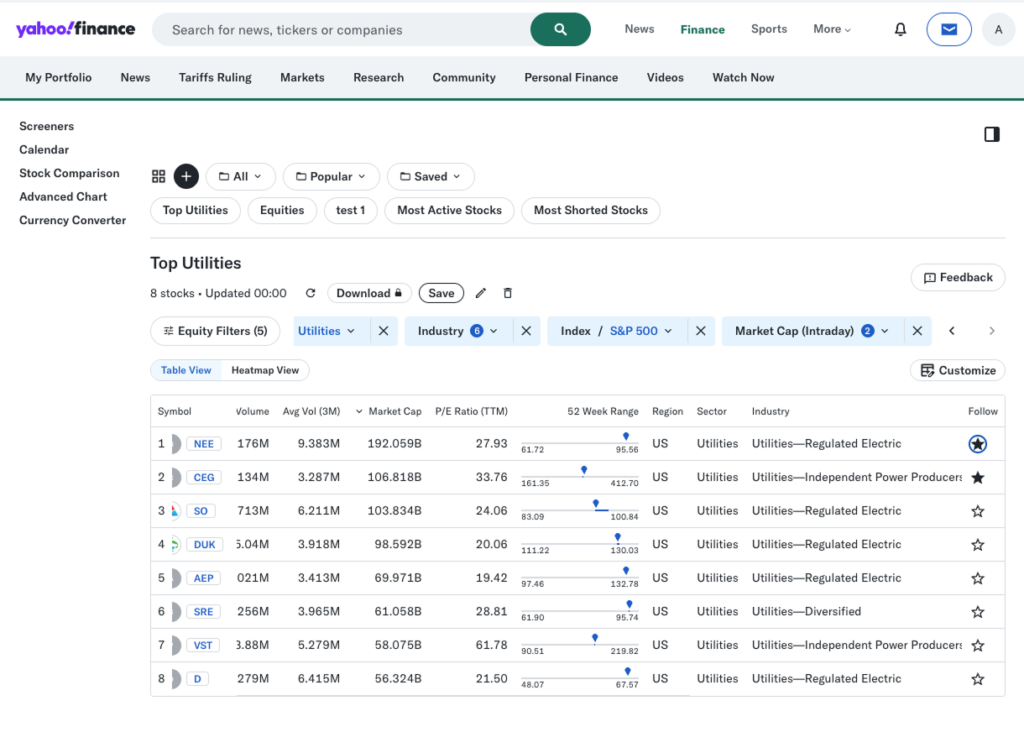
The free version includes the following capabilities.
- 10 filter categories spanning basic fundamental, valuation, risk, and technical criteria.
- Standard financial filters such as trailing P/E, net income, and shareholders’ equity, limited to predefined values.
- Sector and market heat maps for rapid top-down scanning of performance trends.
- 20 predefined screeners covering common use cases such as Most Active, Day Gainers, Day Losers, and 52-Week Highs/Lows.
- ESG data visibility embedded directly within screening results.
- Customizable screens for reorganizing displayed metrics.
- Immediate, no-registration access, enabling instant evaluation.
- Global equity coverage of approximately 5,676 stocks.
After running multiple screens, these features support quick idea generation, broad market exploration, and early-stage filtering, while more structured, rules-based screening and deeper analytical workflows are primarily addressed in the paid offering.
Main limitation of free tier
Based on actual use of the free trial only, the limitations are clear and structural.
- Restricted metric set – The number of available screening metrics is limited, reducing flexibility for multi-factor screening.
- Data definition opacity – Limited transparency around how underlying metrics are calculated or standardized.
- No quarterly filters – Financial statement screening cannot be performed on a quarterly basis.
- No forward-looking metrics – Screening relies primarily on trailing financial data.
- Trailing-only valuation – Valuation analysis is restricted to historical multiples, with no forward valuation context.
- Very limited coverage – The global equity universe is small, which restricts opportunity-set breadth and cross-market comparison.
These constraints limit how far the screener can be used beyond initial discovery. The restricted metric set and lack of forward-looking data make it difficult to evaluate companies in a valuation-driven or expectation-based framework.
Even with these limitations, I view Yahoo Finance’s free screener as a starting point for equity discovery. I would not rely on it as a standalone solution for valuation-focused, forward-looking, or multi-factor investment research, but it remains useful for fast market orientation and surface-level screening.
5. Stock Analysis
Stock Analysis offers an intermediate-level free stock screener app with global equity coverage. The screener allows users to filter stocks using a broad but structured set of valuation, profitability, leverage, growth, and basic technical metrics across international markets. I tested the free screener directly and accessed it after registration. The interface is clean, and real-time data is available without intentional delays.
Stock Analysis clearly sits between beginner screeners and advanced research platforms. It provides more metric depth than entry-level tools, which makes initial screening more precise. However, limitations in workflow persistence on the free tier reduce its effectiveness for building systematic, repeatable research processes over time.
Best for
Stock Analysis is best for intermediate investors who want more structure and metric variety than beginner screeners offer, without moving into advanced or institutional platforms.
After working with the platform, I found it most suitable for:
- Idea shortlisting based on valuation, profitability, and leverage filters
- Global screening where basic international coverage matters more than market-specific depth
- Fundamental-first analysis that combines financial statement data with core technical indicators
- Free-tool users who accept workflow limitations in exchange for unrestricted metric access
Stock Analysis works best as a research accelerator. I use it to narrow large universes into manageable candidate lists, but it is not an optimal choice to run persistent strategies or maintain long-term screening setups.
Key free features
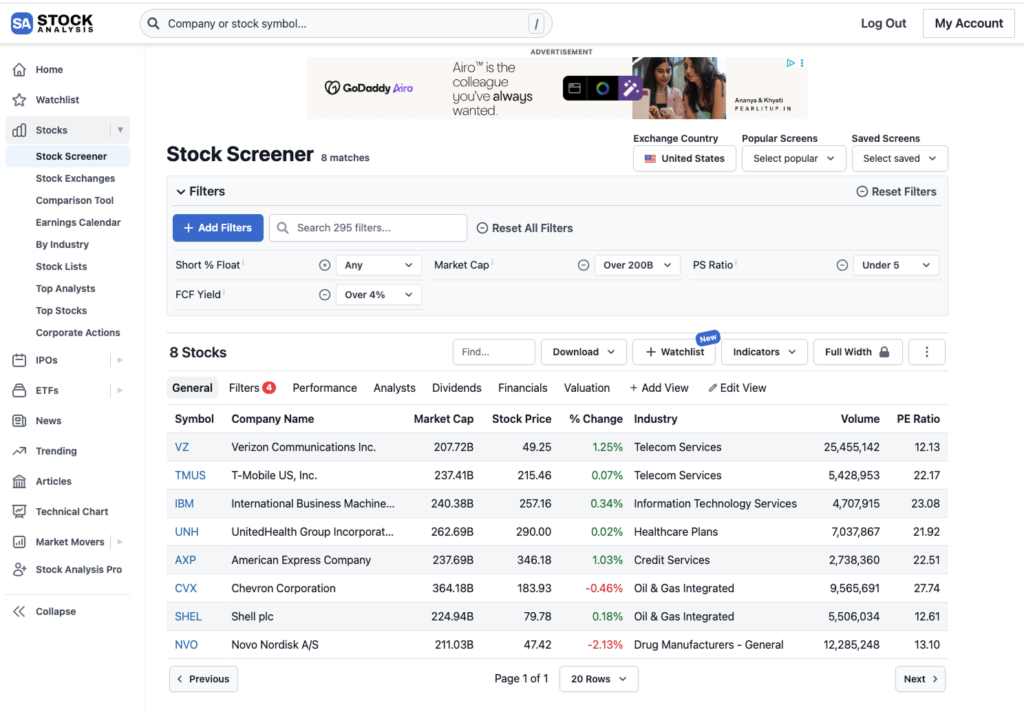
The free tier includes the following capabilities.
- 280 screening filters covering valuation, profitability, leverage, growth, and technical indicators
- Around 300 column options available to customize detailed output configuration
- Core financial statement metrics and technical analysis indicators available without forced upgrades
- Multiple analytical views within the same screener
- Real-time market data without intentional delays
- No registration required for immediate access
- Integrated tools linked to stock comparison features and ETF screening
- Coverage of approximately 30,000 global equities.
Together, these features support serious screening and comparative analysis at no cost, making the free tier suitable for building, refining, and testing screening logic across a large global universe before considering any paid workflow extensions.
Main limitation of free tier
In my opinion, the limitations are significant for workflow efficiency and data clarity.
- Cannot save screeners – Custom screens cannot be saved without upgrading, which prevents building reusable strategies.
- Heavy advertising – A high volume of in-platform ads interrupts workflow and reduces usability.
- Timeframe ambiguity – No clear LTM, NTM, or fiscal year labeling, making metric periods unclear.
- Financial history limited – Constrained historical depth for multi-year analysis.
- Watchlists capped – Limited watchlist capacity on the free plan.
- Quarterly filters absent – No structured quarterly financial statement screening.
- Data refresh inconsistencies – Changing coverage sometimes requires manual refresh.
In real screening conditions, the inability to save screeners is the most material limitation. Screening without persistence forces manual rebuilding of filters, which reduces efficiency for systematic research. The volume of ads further impacts focus during analysis.
Even with these constraints, I would still choose Stock Analysis for intermediate global screening when filter breadth and real-time access matter more than workflow automation or saved strategy management.
6. Koyfin

Koyfin is a professional-grade market data and analytics platform designed to mirror institutional research environments at a lower cost. The platform brings together stock screening, charting, dashboards, and macroeconomic datasets within a single research interface. I tested Koyfin with a specific focus on the free stock screener app. The breadth of available data is substantial, but the interface is dense and requires a meaningful time investment to navigate effectively.
From my experience, Koyfin operates very close to institutional-level tooling. However, the free tier is intentionally restrictive. While it exposes the platform’s depth and structure, it sharply limits how much screening can be performed, positioning the free screener more as an evaluation layer than a fully usable research tool.
Best for
Koyfin is best for professional users who want institutional-style research tools and are evaluating the platform before committing to a paid plan.
From my testing, it suits:
- Data-experienced users comfortable working inside dense, multi-panel research interfaces.
- Estimate-driven investors who rely on analyst forecasts, long historical datasets, and derived ratios as primary inputs.
- Upgrade-oriented evaluators looking to experience a professional research workflow rather than use a free screener long term.
Its positioning becomes clear once you compare what the platform can do versus what the free tier allows.
Key free features
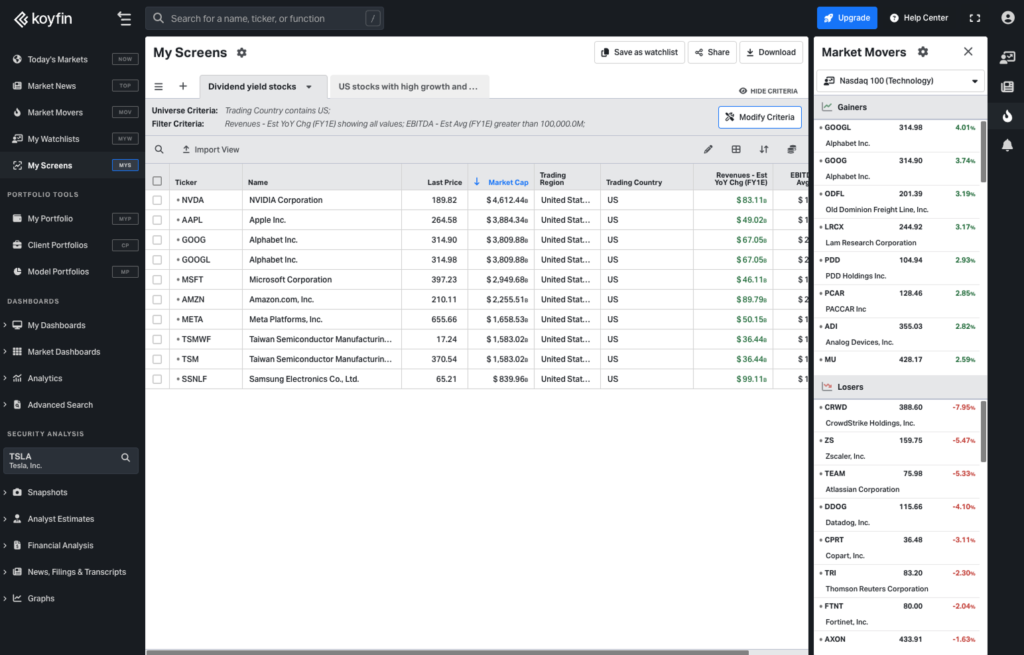
The free tier provides controlled access to Koyfin’s research environment, designed to demonstrate how the platform works rather than support sustained screening.
Access requires registration and includes a brief initial period where broader functionality is visible before stricter limits apply. After that, the free tier allows:
- Registration-required access with a short full-feature exposure period before restrictions apply.
- Stock-only screening on equities.
- Ability to create:
- 2 watchlists
- 2 saved screeners
- 2 chart templates
- 2 customizable screens
- Access to a subset of Koyfin’s fundamental, technical, and performance metrics.
In my experience, the free version is enough to understand how Koyfin’s screening logic, layouts, and metric system work, but not enough to rely on it for ongoing research.
Main limitation of free tier
After running multiple screens, I learned that the free tier is constrained by deliberate structural limits rather than missing features.
- Severely capped screeners – Only two saved screeners allowed.
- Workflow restrictions – Watchlists, dashboards, and chart templates are tightly limited.
- Export disabled – Screening results cannot be exported without upgrading.
- Asset class locked – ETFs and mutual funds require a paid plan.
- Historical depth restricted – Long-term financial history and analyst estimate ranges are unavailable.
- Learning curve remains – Even limited access requires time to understand layout and data structure.
Based on my testing, Koyfin’s free plan (no credit card needed) is best viewed as a controlled preview of a very powerful platform. I would not choose it if my goal were genuinely free stock screening. I would choose it if I wanted to assess whether an advanced, institutional-style research system fits my workflow before upgrading.
7. Seeking Alpha

Seeking Alpha is a fundamental research platform built around quantitative ratings, analyst consensus, and contributor-driven stock research. Its stock screener historically centered on filtering companies based on proprietary ratings, Wall Street estimates, and financial statement metrics. I tested the platform focusing strictly on what is currently usable without upgrading, and the practical value of the free screener has declined.
While Seeking Alpha still covers approximately 24,289 stocks, meaningful screening functionality now sits behind a paid membership. The free tier provides only surface-level visibility into ratings and limited financial data. In its current state, the platform functions more as a preview of premium research tools than as a genuinely usable free stock screener.
Best for
Seeking Alpha is best for investors who accept limited free functionality and are prepared to upgrade quickly for access to its rating-driven research framework.
From direct testing, it best fits:
- Investors who rely primarily on proprietary ratings, factor grades, and contributor sentiment rather than self-built screening logic.
- Fundamental-focused users prioritizing earnings revisions, profitability, valuation grades, and analyst consensus over technical signals.
- Users who want screening tightly coupled with editorial content and are comfortable paying to unlock meaningful analytical depth.
It is not positioned for traders or users seeking robust free screening, advanced technical filters, or the ability to customize results at a granular level without upgrading.
Key free features
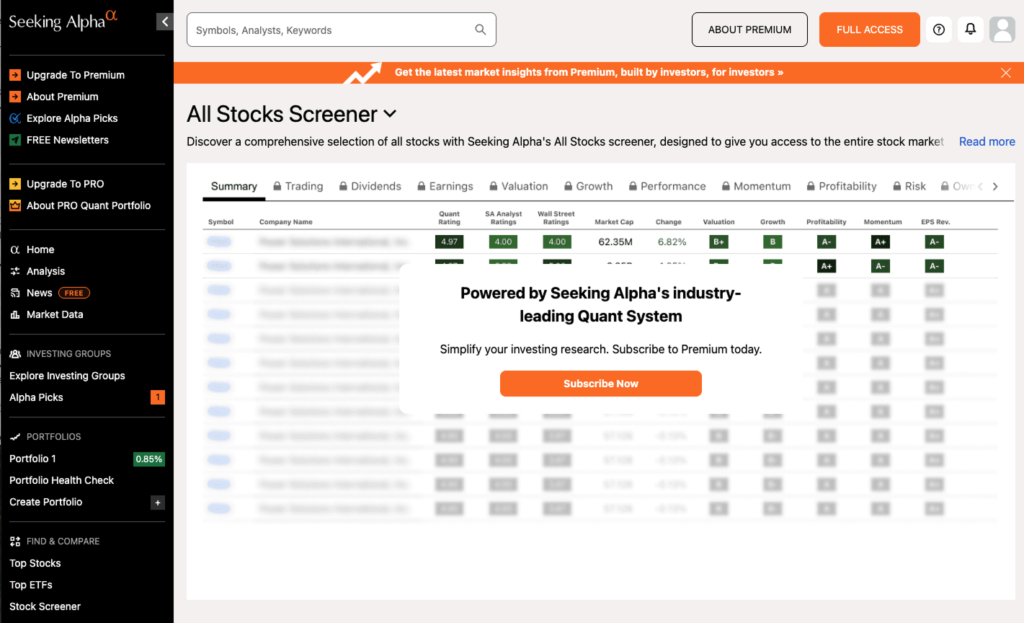
The current free trial version provides minimal functional screening access. Most meaningful features are locked behind a paid subscription.
- Severely restricted screener access – Custom screening and meaningful filter use are effectively unavailable without upgrading.
- Surface-level Quant Ratings – Only high-level rating summaries are visible, with no detailed component breakdown.
- Gated editorial content – Contributor analysis and deeper research locked behind paywalls.
The free version does not operate as a usable stock screener anymore. It allows limited browsing of individual stocks, but it does not support structured, multi-factor screening or repeatable research workflows.
Main limitation of free tier
Based on real use, the limitations are structural and intentional.
- Custom screening locked – Full screener functionality requires a paid subscription.
- Rating transparency restricted – Full Quant breakdown and contributor detail unavailable on free tier.
- Very limited filter depth – Advanced filtering criteria are inaccessible.
- Workflow constrained – Screens cannot be meaningfully saved or refined without upgrading.
- Fundamental-only focus – Minimal technical or price-action filtering.
- Clunky interface – Building custom screens requires multiple navigation steps.
- Free tier not usable for research – Designed primarily as a gateway to paid plans.
Seeking Alpha’s free screener no longer operates as a practical research tool. It is best viewed as an entry point to a paid, opinion-driven fundamental research system rather than as a standalone free stock screener. If the goal is genuinely free screening, other platforms offer materially more usable functionality.
8. WallStreetZen

WallStreetZen is built around a simplified stock rating framework rather than traditional multi-factor screening. The platform centers on its proprietary “Zen Ratings” system, which groups companies by themes such as Value, Growth, Momentum, Sentiment, Safety, Financial strength, and AI rating. I tested the free screener with a focus on real-world usability, and the experience is dominated by restrictions and frequent in-platform advertising.
In practice, the free version feels more like a promotional preview than a functional screening tool. Between locked features and constant ads, it is difficult to stay focused or work through stocks in a structured way.
Best for
WallStreetZen free screener is designed for low-effort stock exploration, not structured, rules-based screening.
Based on direct testing, it is best suited for:
- Beginners seeking pre-curated stock ideas without constructing or managing screening criteria.
- Users who prefer binary pass/fail evaluations instead of analyzing underlying financial metrics.
- Prospective users sampling the platform to evaluate whether the paid version justifies deeper use.
It is a poor fit for investors who need hands-on control over screening criteria, clear visibility into underlying metrics, the ability to build custom logic, or a workflow that supports continuous, in-depth research.
Key free features
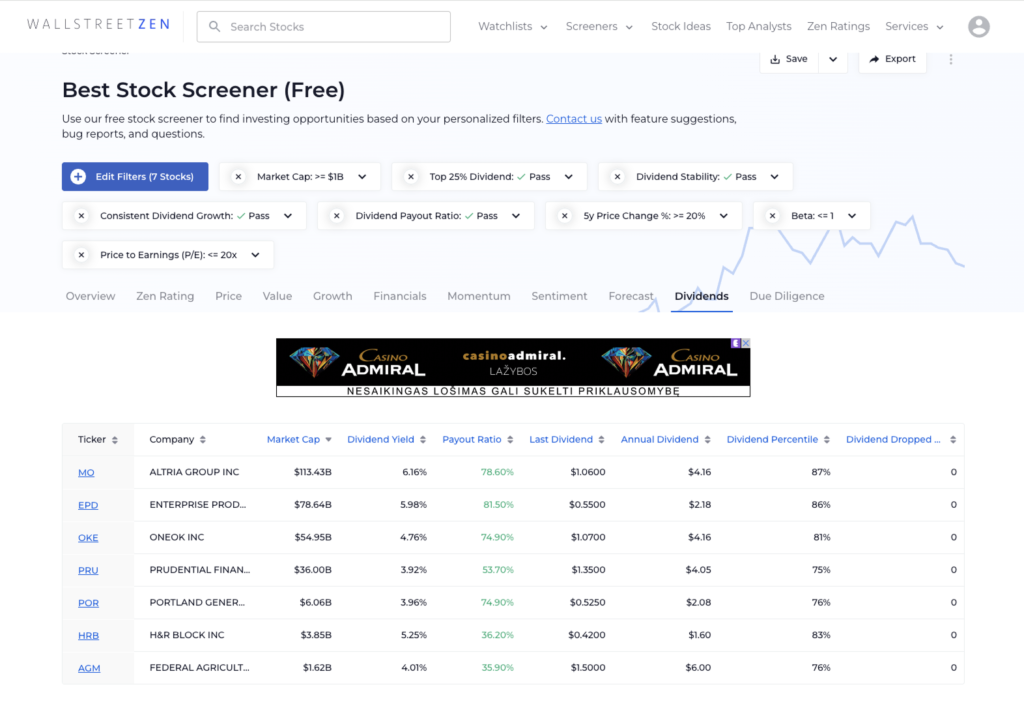
The free tier offers a very narrow and ad-heavy experience.
- Around 10 predefined stock screens with fixed logic.
- Basic price data and trailing valuation multiples only.
- Minimal income statement and balance sheet figures, mostly LTM.
- A small sample of consensus indicators such as earnings or revenue growth.
- The “DD Score” shown only as pass or fail, with limited transparency.
- Coverage of roughly 5,440 companies.
- Frequent in-platform ads that interrupt navigation and analysis.
In my experience, these features allow quick idea exposure but provide little context or depth.
Main limitation of free tier
The free tier is constrained across data access, customization, workflow, and usability.
- Zen Ratings locked – Core rating components such as Value, Growth, Momentum, Sentiment, Safety, Financing, and AI rating are paywalled.
- No customization – Filters, criteria, and output columns cannot be modified.
- No persistence – Screens cannot be saved or reused.
- Trailing-only data – No quarterly views, no forward metrics, no estimates.
- Consensus data hidden – Analyst upside and detailed forecasts are unavailable.
- Very limited universe – Coverage is small relative to most competitors.
- Heavy advertising – Persistent ads reduce usability and disrupt research flow.
WallStreetZen’s free screener is best viewed as an introductory discovery layer rather than a full screening solution. It is structured to surface paid ratings and summaries, which limits its usefulness for independent valuation work, multi-factor screening, or forward-looking research without upgrading.
9. Simply Wall St

Simply Wall St is a visual-first stock research platform built around its proprietary “snowflake” framework. The screener organizes companies using five dimensions. Dividend, Value, Future, Past, and Health. Each dimension is scored across five levels, producing a simplified visual assessment rather than detailed numerical analysis. I tested the free screener focusing strictly on what can be done without upgrading.
The free screener provides limited functionality.. It offers many predefined screens, but very little control over how those screens are constructed or refined. Most meaningful customization and deeper data access are largely restricted, with most advanced capabilities locked behind a paywall.
Best for
Simply Wall St is best for visual-first investors who want high-level stock ideas without working directly with raw financial data.
From my testing, it suits:
- Investors who prefer simplified visual scoring instead of detailed financial breakdowns.
- Beginners who want curated stock lists without configuring filters.
- Idea-stage research where quick thematic discovery matters more than metric-level precision.
Serious valuation work, forecast-based screening, and disciplined multi-factor investing cannot be executed effectively on the free tier.
Key free features
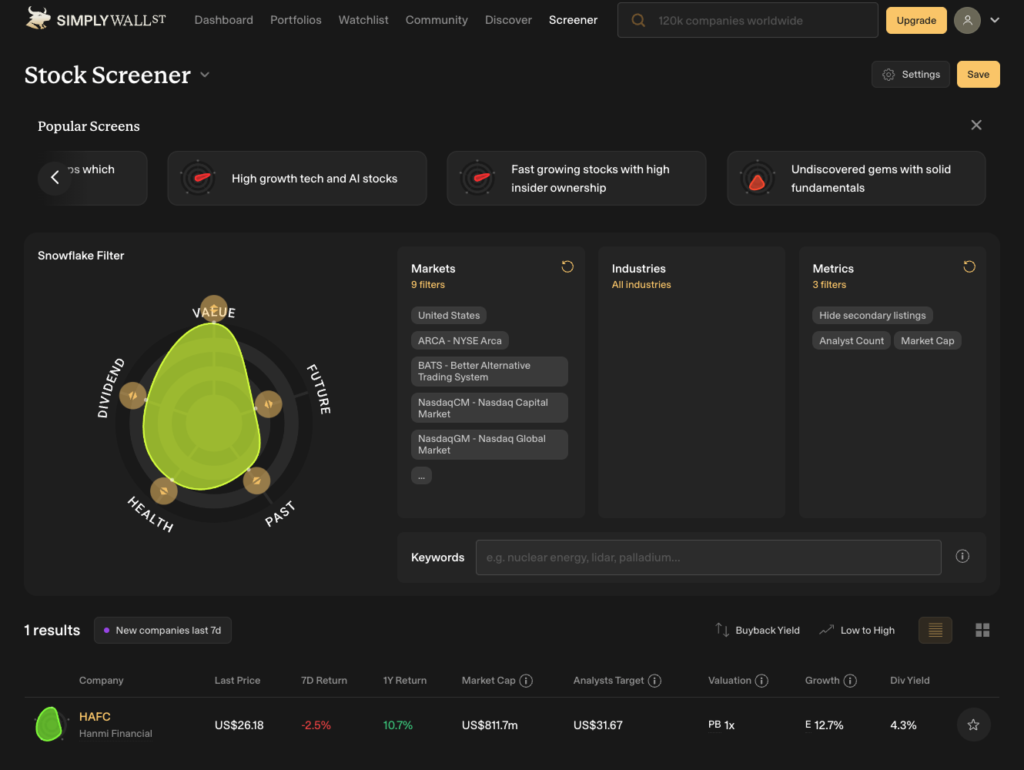
The free tier focuses on predefined discovery rather than flexible screening.
- 200+ predefined screeners, built around thematic and category-based ideas.
- Snowflake-based screening framework, using five dimensions with five scoring levels each.
- Basic market and industry filters for high-level segmentation.
- Minimal financial statement data, with no ability to select reporting periods.
- Fixed output layout, with no customizable columns.
- Coverage of approximately 54,538 stocks globally.
In my experience, this feature set reflects a predefined, visually oriented screening approach rather than a configurable analytical workflow.
Main limitation of free tier
At the free trial version, limitations are most apparent in analytical control and screening flexibility, rather than in visual presentation.
- No custom screening logic – Free screening is restricted to predefined snowflake rules, with no ability to define or adjust criteria.
- Very limited filter set – Fewer than 70 total filters are available across all categories.
- Minimal forecast and estimate access – Only less than 10 forward-looking filters are available, with no meaningful consensus depth.
- Trailing-only data – Valuation and financial metrics are historical, with unclear or fixed timeframes.
- Restricted financial statements – Income statement and balance sheet data are limited, with no selectable reporting periods.
- No column customization – Output layout is fixed and cannot be tailored.
- Constrained result visibility – Free screens often display only a small subset of matching stocks.
- Paywall-heavy experience – Most analytical depth and flexibility require upgrading.
Simply Wall St’s free screener works as a visual idea generator, not as a serious screening tool. It can help surface high-level concepts quickly, but it does not support structured analysis, valuation work, or repeatable screening workflows without moving to a paid plan. Most investor recommendations are to use it for quick visual exploration, then switch to more advanced screeners for deeper financial analysis and systematic filtering.
What is the best free stock screener?
There is no single best free stock screener app for everyone. The right choice depends on how you invest, what data you rely on, and how much structure you need in your research process.
If you want quick market checks, Yahoo Finance is enough. It is useful for seeing which stocks are active today, which sectors are moving, and how basic valuation metrics look. It is fast and accessible, but the filter set is small and the data is mostly historical.
If your focus is technical analysis, Finviz and TradingView are better options. Finviz works well for fast scans of U.S. stocks based on momentum, patterns, and indicators. TradingView adds international markets and direct chart integration across stocks, ETFs, crypto, and futures. Both are strong for price-based screening, but their free tiers offer limited fundamental depth and no forward-looking data.
If you want to evaluate institutional-style research tools, Koyfin provides advanced datasets and analytical structure. However, its free tier is tightly restricted and primarily serves as a preview of a paid system.
If you are looking for the most comprehensive free stock screener, Gainify stands out clearly. It combines:
- Global equity coverage across more than 85,000 stocks, including both primary and secondary listings
- 500+ screening parameters available for free, covering financial fundamentals, valuation, growth, quality, risk, and technical signals
- Forward-looking analyst data, including estimates and projection-based filters rather than trailing figures only
- Institutional-grade datasets used across screening and analysis
- AI-assisted stock discovery using natural-language investment queries
- Fully customizable result columns, with any of the 500+ parameters selectable in the output table
In other words, the best free stock screener is the one that matches your process. Fast checks, technical scans, professional evaluation, and structured research all point to different tools. The key is choosing a platform whose free tier supports the way you actually screen and analyze stocks, rather than forcing you to simplify or rebuild your workflow.
Why Free Stock Screeners Matter in 2026
Free stock screeners matter in 2026 because the stock market has become too large and too complex to approach without filtering. With thousands of listed companies across U.S. and international exchanges, screening is the fastest way to move from “everything that exists” to a short list that is actually worth analyzing.
Here are the main reasons free stock screeners have become essential, and how investors use them in practice.
- Whole-market coverage is impossible to analyze manually. Even a single exchange contains thousands of stocks. A screener does the first pass for you by applying objective filters such as valuation, growth, balance-sheet strength, or market size. This turns a massive universe into a manageable list you can realistically research.
- Free tools now offer serious analytical depth. A few years ago, advanced screening required paid platforms. Today, free screeners include multi-factor fundamentals, technical indicators, and in some cases forward-looking data. That allows retail investors to apply structured analysis without paying for institutional tools.
- Free stock screeners help surface opportunities earlier. Screeners make it easy to surface stocks that meet specific conditions, such as improving margins, accelerating revenue, or low valuation relative to peers. This is often the first step when researching themes or looking for opportunities using undervalued stock screeners.
- Screeners enforce discipline instead of guesswork. Screening replaces opinions with rules. When you define criteria and let the data decide which stocks qualify, you avoid chasing headlines or overreacting to short-term noise. This is especially important when systematically finding undervalued stocks across large markets.
- Free stock screeners support different investing styles. Value investing strategies use screeners to narrow down candidates for deep fundamental research. Traders use them to identify momentum, breakouts, or volume spikes. Free screeners make both approaches accessible without committing to expensive software.
- Free screeners provide a much cheaper alternative to paid platforms. Many free screeners now provide capabilities that were previously available only in expensive research software. While paid platforms still offer deeper datasets and automation, free tools allow investors to run multi-factor screens, analyze financial metrics, and explore global markets at a much cheaper cost than paid versions.
In simple terms, best free stock screener apps save time, reduce noise, and improve decision-making. In 2026, they are no longer optional tools. They are the starting point for anyone who wants to invest with structure rather than intuition.
Conclusion: Your Path to Better Investment Research
With the right free stock screener, instead of relying on tips from financial media, you have the tools to systematically find stocks that match your exact criteria.
The free stock screeners we’ve analyzed each serve different investor needs.
Yahoo Finance offers a frictionless starting point for beginners who need quick insights and basic filtering without registration.
Finviz and TradingView focus on technical-first workflows, combining price-based filters, charting tools, and visual market scanning to support momentum traders and short-term setup identification for day trading.
Koyfin sits in the professional research category, providing institutional-style financial datasets, macro integration, and advanced customization suited for experienced users comfortable with complex interfaces.
However, if you’re serious about finding winning investments across global markets, Gainify is my recommendation. With 85,000+ stocks, 500+ screening metrics, and AI-powered discovery available on a genuinely usable free tier, it provides research capabilities that comparable platforms typically reserve for paid plans.
Frequently Asked Questions
What is a stock screener?
A stock screener is a tool that filters thousands of stocks based on specific criteria like P/E ratio, market cap, or dividend yield to help you find investment opportunities matching your strategy. For a full explanation, see what is a stock screener.
Do I really need a stock screener for investing?
While not mandatory, my recommendation is to use stock screeners to discover opportunities beyond the popular stocks covered in financial media. They’re especially valuable for value investing, helping investors find undervalued stocks or companies that match specific financial criteria across global markets. Not sure where to start? Here’s how to use stock screeners to find stocks that match what you’re actually looking for.
Can free stock screeners compete with paid versions?
Yes, some free screeners like Gainify offer institutional-grade accurate data and features. However, most free versions have limitations like delayed data, result caps, or restricted filtering options designed to encourage upgrades.
For many investors, free screeners are the starting point rather than the end goal. Understanding how different platforms evolve from free access into full research systems makes it easier to choose the right path. A comparison of the best stock screeners provides context on which tools are built for long-term use and which serve more limited roles.
What’s the main limitation of most free stock screeners?
The most common restrictions are: limited search results (showing only 20-50 stocks), delayed data (15-20 minutes), inability to save screens, and restricted access to advanced filters or international markets.
Which free screener is best for beginners?
Yahoo Finance requires no registration and offers simple filters, making it ideal for beginners. However, Gainify’s pre-built screeners and AI assistance make complex screening accessible even for newcomers.
Can I screen international stocks for free?
Yes, Gainify covers 85,000+ global stocks across 150+ exchanges on its free tier. TradingView also offers international coverage. Most others like Stock Analysis focus only on US markets.
How accurate is the data in free stock screeners?
Data accuracy varies by platform. Gainify uses S&P Global Market Intelligence (institutional-grade data), while others may have 15-20 minute delays. Always verify critical information before making investment decisions.
Should I use multiple free screeners?
Many investors combine 2-3 platforms to overcome individual limitations. However, comprehensive platforms like Gainify may eliminate this need by offering complete functionality in one place.
When should I upgrade to a paid screener?
Upgrade when stock screening is part of your regular investing routine and free tools begin to slow you down. A paid screener makes sense if you need more advanced filters and unlimited strategy saving. The best stock screeners can also give you an edge by revealing opportunities that are not visible to the crowd.
What screening criteria should I start with?
Begin with basic filters like market cap, P/E ratio, and sector. As you gain experience, add criteria like revenue growth, debt-to-equity, ROE, and forward earnings estimates to refine your searches.