

The Price-to-Earnings (P/E) ratio is one of the most essential and widely used tools in equity valuation. Although the concept is straightforward, the P/E ratio is often misunderstood or misapplied, especially by newer investors.
In this article, you will learn how to calculate P/E, understand what a good P/E ratio is to buy a stock, and recognize what a bad P/E ratio is that may signal potential risk.
Whether you are a beginner investor, financial analyst, or simply looking to make smarter investment decisions, this guide will give you a clear understanding of how to use the P/E ratio effectively in today’s market.
What Is the P/E Ratio?
The price-to-earnings (P/E) ratio is a valuation metric that compares a company’s current share price to its earnings per share (EPS). It shows how much investors are willing to pay for $1 of a company’s earnings.
In practical terms, the P/E ratio helps investors quickly assess whether a stock appears expensive or cheap relative to its profitability. A higher P/E suggests that investors expect stronger future growth, while a lower P/E may indicate slower growth, higher risk, or potential undervaluation.
Because it links price and earnings in a single number, the P/E ratio is commonly used as a first-pass valuation tool across equities, ETFs, and entire market indices.
P/E Ratio Formula
The formula for calculating the price-to-earnings ratio is:
P/E Ratio = Price per Share ÷ Earnings per Share (EPS)

- Price per Share is the current trading price of the stock on the market.
- Earnings per Share (EPS) represents the company’s net income divided by its total number of outstanding shares.
This formula can be applied using trailing earnings (TTM), forward earnings, or next twelve months (NTM) estimates, depending on the type of P/E ratio being analyzed.
How to Calculate P/E Ratio
Calculating the price-to-earnings (P/E) ratio is a straightforward process that compares a company’s market price to its earnings. This calculation helps investors understand how much the market is willing to pay for each dollar of profit.
To calculate the P/E ratio, follow these steps:
- Find the current price per share: this is the latest trading price of the stock on the market and reflects current investor demand.
- Determine earnings per share (EPS): Earnings per share represent the company’s net income divided by the total number of outstanding shares. EPS can be calculated using trailing twelve months (TTM) earnings, forward estimates, or next twelve months (NTM) projections, depending on the type of P/E ratio being used.
- Divide the price per share by EPS: divide the stock’s current price by its earnings per share to arrive at the P/E ratio.
This step-by-step process allows investors to quickly assess whether a stock appears relatively expensive or inexpensive and serves as a foundation for more advanced valuation analysis when combined with industry comparisons, growth expectations, and historical trends.
P/E Ratio Calculation Example
As of the last trading day of 2024, Apple Inc. (AAPL) closed at $250.42 per share. For the same period, Apple reported earnings per share (EPS) of $6.75.
Using the P/E ratio formula:
P/E Ratio = Price per Share ÷ Earnings per Share
P/E = $250.42 ÷ $6.75 = 37.1
This means investors were willing to pay approximately $37.10 for every $1 of Apple’s earnings at that time.
A P/E ratio at this level suggests that the market had strong expectations for Apple’s future growth, profitability, or competitive position heading into 2025. However, whether this P/E is considered high or reasonable depends on factors such as Apple’s historical valuation, growth outlook, and comparisons with other large-cap technology companies.
Types of P/E Ratios
While the P/E ratio formula is simple, the type of earnings used can significantly change the result. Investors commonly rely on three variations of the P/E ratio, each serving a different purpose.
1. Trailing P/E Ratio (TTM)
Definition:
Uses the company’s actual EPS over the past 12 months to calculate the price-to-earnings ratio. This is the most commonly reported P/E figure.
Data Source:
Based on financial results from the last four quarters, using GAAP or non-GAAP earnings, depending on the reporting method.
Purpose:
Provides a valuation based on historical performance, helping investors assess what the market is paying for actual, realized earnings.
Pros:
- Based on audited and reported financial data
- Straightforward to calculate and widely used
Cons:
- Does not reflect future growth expectations
- May be influenced by seasonal earnings patterns or non-recurring events
2. Next Twelve Months (NTM) P/E Ratio
Definition:
The NTM P/E ratio is a forward-looking, rolling valuation metric that calculates the P/E based on expected earnings over the next 12 months from today, rather than a fixed fiscal year.
Data Source:
Regularly updated based on the latest analyst forecasts and earnings estimates. This metric is commonly used by institutional investors and financial professionals for real-time valuation.
Purpose:
Offers a more dynamic and current perspective than traditional Forward P/E by continuously adjusting to new earnings expectations throughout the year.
Pros:
- Reflects up-to-date market sentiment and forecasts
- More precise than standard Forward P/E during mid-year or earnings season shifts
Cons:
- Depends heavily on forecast accuracy
- Less commonly available on public platforms compared to TTM or Forward P/E
3. Forward P/E Ratio
Definition:
The Forward P/E ratio uses estimated earnings for the upcoming fiscal year, typically based on company guidance or analyst consensus forecasts.
Data Source:
Derived from forward-looking projections rather than historical data. These estimates are published by equity analysts or provided by the company itself.
Purpose:
Helps investors evaluate a stock’s future valuation, making it especially useful for analyzing companies with rapidly changing earnings profiles over time.
Pros:
- Reflects market expectations for earnings growth
- Useful for forecasting future returns and comparing with peer companies
Cons:
- Based on estimates, which may be overly optimistic or conservative
- Can be less reliable during volatile market conditions or economic uncertainty
What Is a Good P/E Ratio to Buy a Stock?
When it comes to identifying a “good” P/E ratio, there’s no one-size-fits-all answer. The ideal P/E depends on the company’s industry, growth rate, market cycle, and overall financial health. A P/E that signals opportunity in one sector could suggest overvaluation in another.
To make smarter investment decisions, investors should evaluate P/E ratios using sector benchmarks, growth expectations, and comparisons to market averages.
A. Compare P/E Ratio Within the Same Sector
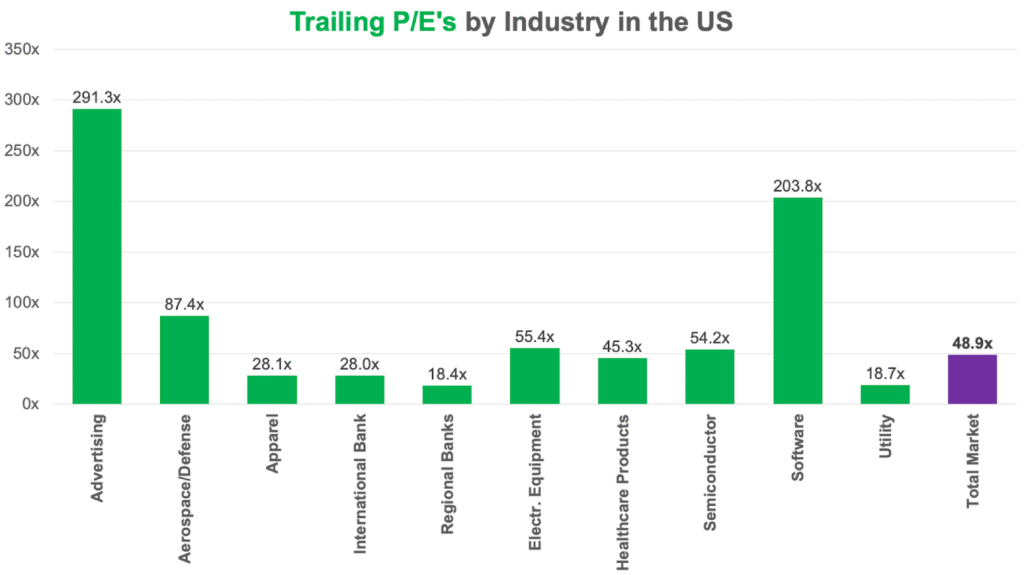
One of the most common mistakes investors make when interpreting P/E ratios is applying a fixed benchmark across all sectors. In reality, what qualifies as a “good” P/E ratio varies widely by industry and even more so over time.
The chart above offers a snapshot of trailing P/E ratios across major U.S. industries in 2024, highlighting just how drastically valuation multiples can differ.
For example, sectors like advertising and software command extremely high earnings multiples (well above 200x) driven by aggressive growth expectations and scalable, intangible business models.
On the other hand, more mature, capital-intensive sectors such as utilities and regional banks tend to trade in the 15x–20x range, reflecting their predictable but slower earnings growth.
These distinctions are not just academic—they’re foundational for sound investment analysis.
Key Principles to Remember:
- Compare within the same sector. A P/E of 35 might signal opportunity for a software firm, but could be a red flag in the utility space. Always assess valuation in relation to sector peers.
- Recognize business model differences. Industries driven by innovation, intellectual property, and recurring revenue often justify higher valuations than those built on tangible assets and regulated pricing.
- Understand that multiples are dynamic. P/E ratios fluctuate with economic cycles, interest rates, and investor sentiment. During bull markets or tech booms, growth sectors often see P/E inflation, while defensive sectors become relatively cheaper. In bear markets, the reverse may hold true.
- Watch for outliers. Extremely high or low P/E ratios can sometimes be explained by non-recurring income, cyclical downturns, or unusual expectations baked into stock prices. Always dig deeper into the earnings quality.
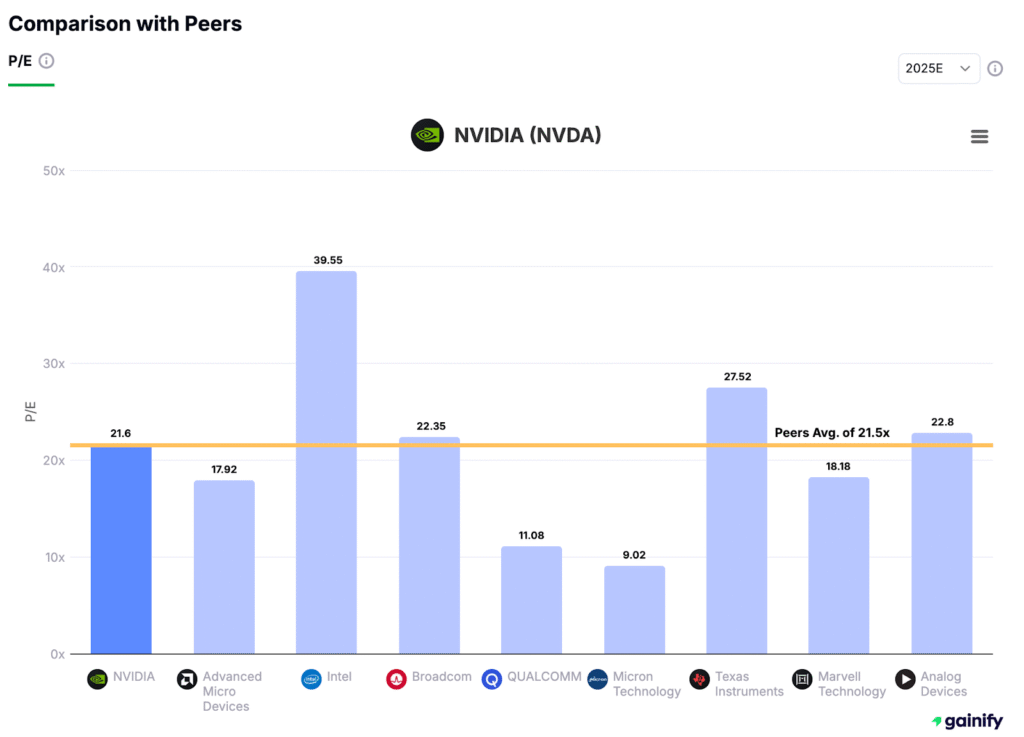
B. Compare P/E to Industry Peers
Evaluating a stock’s P/E against its peers is essential for understanding relative valuation. In the chart below, NVIDIA (NVDA) trades at a 2025E P/E of 21.6x, almost exactly in line with the peer group average of 21.5x.
Despite being a dominant player in AI and high-performance computing (sectors typically priced at a premium), NVIDIA’s multiple is:
- Lower than Intel (39.6x) and Texas Instruments (27.5x)
- Similar to Broadcom (22.4x) and Analog Devices (22.8x)
- Above cyclical names like Micron (9.0x) and Qualcomm (11.1x)
C. Compare P/E Ratio to the Broader Market
In addition to industry-specific comparisons, it’s equally important to assess how a stock’s valuation stacks up against the broader U.S. equity market. One widely used benchmark is the total market average P/E ratio, which includes large-cap, mid-cap, and small-cap stocks across all sectors.
According to recent data, the total market trades at a trailing P/E ratio (2024) of approximately 48.9x. This figure offers a broader lens on investor sentiment and valuation trends beyond just large-cap indices like the S&P 500.
Why This Matters:
- A stock trading far above the market average (e.g. 30x or more when the S&P 500 is at 22x) must justify that premium through superior fundamentals such as exceptional revenue growth, strong competitive advantages, or highly scalable business models.
- Conversely, stocks trading below the market average may offer value opportunities, especially if they have stable earnings, healthy balance sheets, or are temporarily out of favor due to cyclical or sentiment-driven factors.
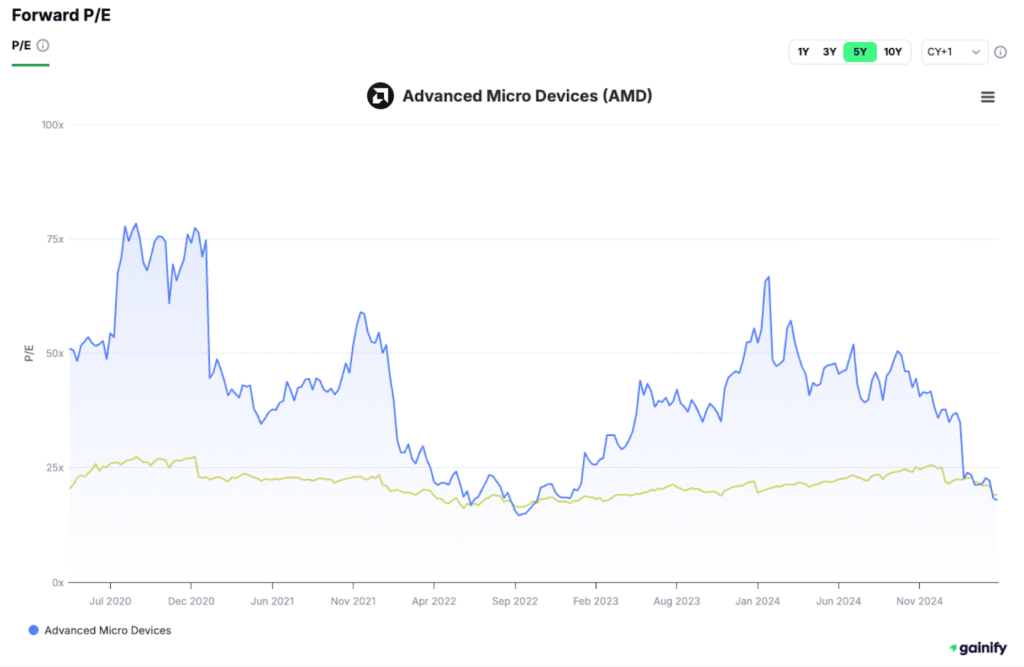
D. Evaluate P/E in a Historical Context
A company’s current P/E ratio becomes more meaningful when viewed alongside its own historical valuation range. Over time, P/E ratios fluctuate based on changes in growth rates, business maturity, interest rates, and broader market cycles.
Why this matters:
- A stock trading below its 5- or 10-year average P/E may indicate undervaluation, assuming fundamentals remain intact.
- A higher-than-average P/E could be justified by accelerating growth or new competitive advantages, but may also signal overvaluation if earnings aren’t keeping pace.
- For cyclical industries, understanding how P/E expands and contracts during different phases of the economic cycle helps avoid buying at the top or selling at the bottom.
What Is a Bad P/E Ratio?
While the price-to-earnings (P/E) ratio is a widely used valuation tool, it can be misleading if interpreted without context. A “bad” P/E ratio is not defined by the number alone, but by what that number reflects about the company’s fundamentals, expectations, and risks.
Below are key scenarios where the P/E ratio should raise red flags.
A. Extremely High P/E Ratio (80x to 100x or more)
A very high P/E ratio often signals unrealistic expectations or speculative behavior, especially when earnings growth cannot justify the valuation. This is common in:
- Early-stage tech or biotech companies
- Hot IPOs with little to no profitability
- Sectors inflated by short-term hype or market momentum
In these cases, valuations are driven more by story than substance. A high P/E may be tolerated if future earnings are expected to accelerate rapidly, but without consistent results, the stock becomes highly vulnerable to sharp corrections.
Key risk: If growth stalls or expectations reset, these stocks can experience significant multiple contraction.
B. Extremely Low P/E Ratio (Under 6x)
A very low P/E can appear attractive, but it often reflects fundamental deterioration, not hidden value. Warning signs include:
- Declining revenues or operating margins
- Heavy debt burdens or deteriorating credit quality
- Legal, regulatory, or industry headwinds
- Business models in long-term decline
Before considering a low P/E stock as a value opportunity, investors must assess whether earnings are sustainable and whether the market has priced in a permanent impairment. Some low-P/E stocks are genuine bargains, but many are value traps.
Key approach: Scrutinize free cash flow, debt levels, and strategic outlook before assuming undervaluation.
C. Negative P/E (No Earnings)
A negative P/E means the company has reported net losses. In this case, the metric becomes mathematically irrelevant for valuation purposes.
Instead, investors should use alternative metrics such as:
- Price-to-Sales (P/S) for early-stage or high-growth companies
- Enterprise Value-to-EBITDA (EV/EBITDA) for capital-intensive businesses
- Cash burn rate and runway (especially for pre-revenue firms)
- Revenue growth and margin improvement potential
This situation is common in startups, biotech firms, and turnaround candidates, where profitability may be years away but growth potential or intellectual property is still being monetized.
Final Thought: Use the P/E Ratio the Right Way
The P/E ratio is one of the most important tools in stock valuation, but its value depends on how it is applied. To make accurate comparisons, always use the same type of P/E, whether trailing, forward, or next twelve months. Analyze it alongside growth rates, industry benchmarks, and a company’s own historical valuation. A high P/E may reflect strong future earnings potential, while a low P/E could signal undervaluation or underlying risk.
Understanding how to use the P/E ratio effectively helps investors determine what is a good P/E ratio to buy a stock and how to avoid common valuation traps. When combined with other metrics like free cash flow, profit margins, and return on capital, the P/E ratio becomes a powerful part of any investor’s decision-making process. Used correctly, it offers clear insight into how the market values a company’s earnings and future potential.