
Technical analysis is everywhere. Open YouTube, scroll through X (Twitter), or browse any trading software, and you’ll see Japanese candlestick charts, support resistance lines, and Bollinger Bands lighting up screens. But beneath the buzz lies a deeper question: does any of this actually work?
Whether you’re trading growth stocks, analyzing the S&P 500, or exploring foreign exchange markets, chances are you’ve seen someone draw a trend line, reference a Death Cross, or mention the Elliott Wave Principle. This style of analysis promises to decode price patterns, uncover support levels, and identify reversals before they happen. But how effective are these tools in the real world?
To answer this, we’ll examine what academic research, professional traders, and historical data actually reveal. You’ll also learn where tools like Fibonacci ratios, Parabolic SAR, and Ichimoku cloud may provide an edge and where they fall short.
By the end, you’ll understand when technical signals add real value and when it’s more effective to step back and rely on broader market activity, macroeconomic trends, or fundamental strategies.
What is Technical Analysis? A Quick Overview
Technical analysis focuses on studying market-derived data such as stock price charts, trading volume, and historical trends to predict future price movements. Unlike fundamental analysis, which looks at company’s financials, technical analysts use tools like:
- Candlestick chart patterns (e.g., hammer, doji, engulfing formations)
- Moving Average Indicators (50-day, 200-day moving averages)
- Volatility and momentum tools like Bollinger Bands, Average True Range, and the A/D line
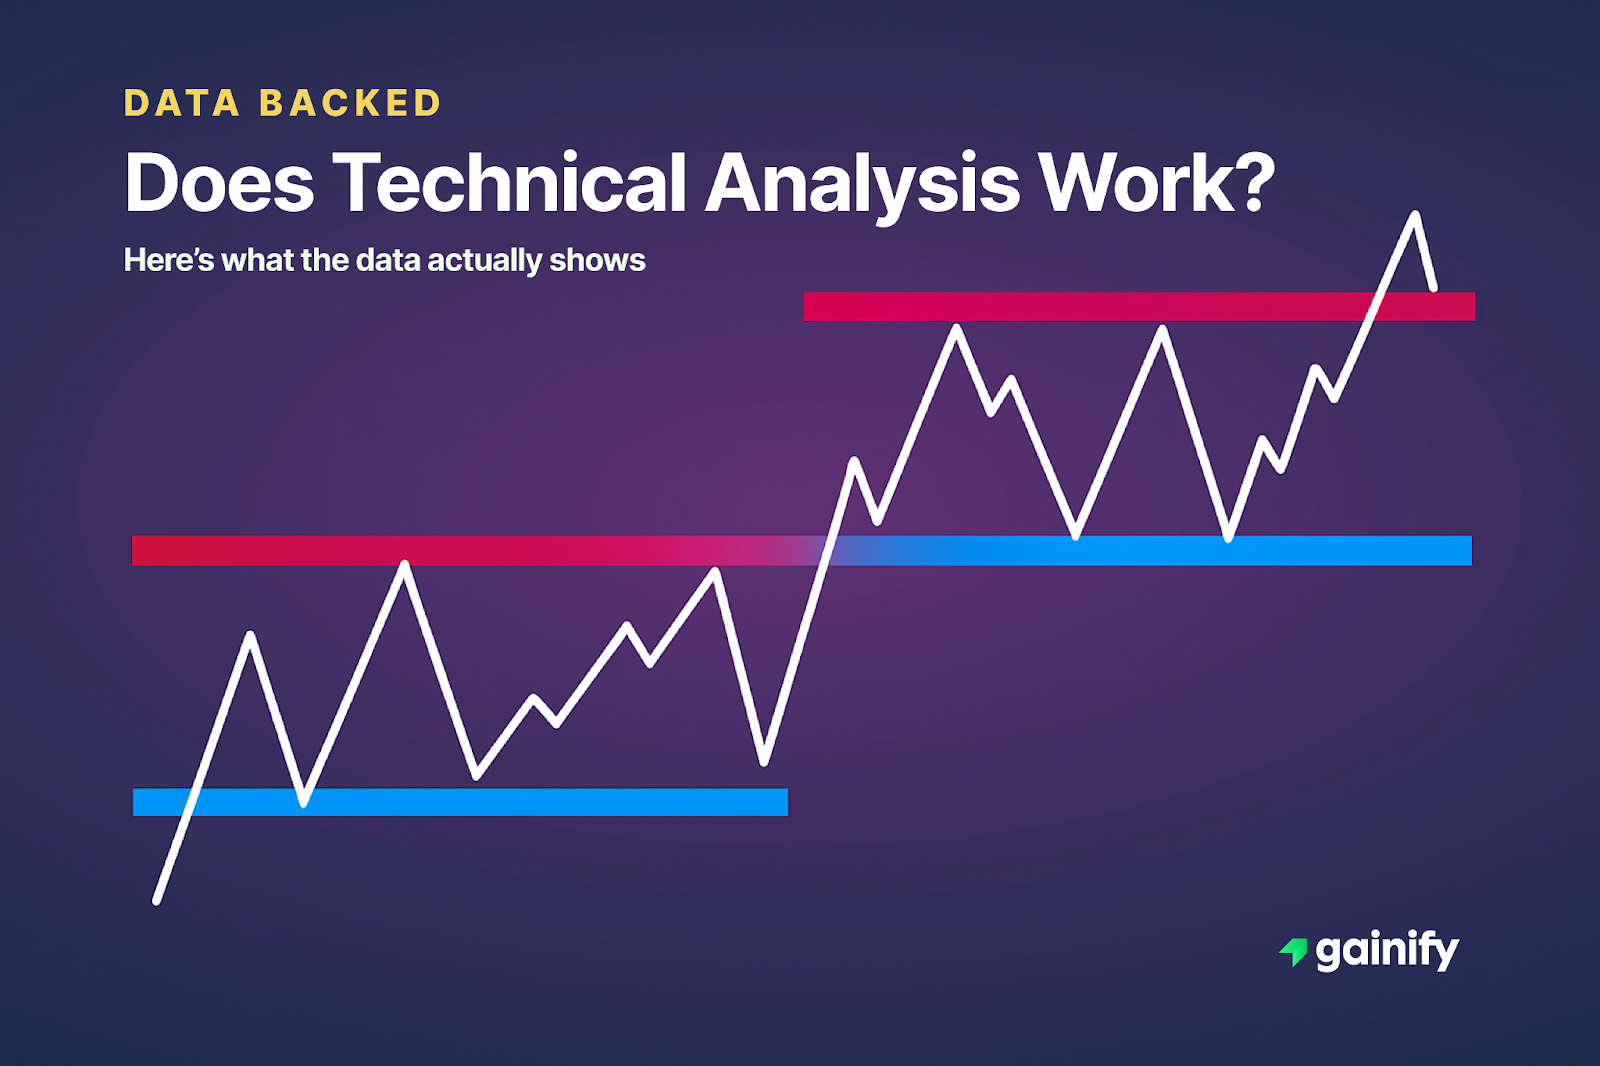
- Support and resistance-based levels using Fibonacci retracements, pivot points, and Ichimoku Kinko Hyo
- Chart types including OHLC (open-high-low-close) charts, bar charts, and point and figure charts
These tools are often found in platforms like TradingView Pro+, MetaTrader 4, or more advanced setups like Radical X13 EZ Trading Computer. Whether you’re in forex trading, swing trading, or watching stock markets, these systems help identify trends and timing.
Where Technical Analysis Works
Not all technical tools are created equal. However, when used properly, some have statistical merit, specially in short-term trading.
Here’s where it can be effective:
- Momentum-based strategies (such as trend-following using moving averages) have shown consistent short-term performance, according to peer-reviewed studies like those by Jegadeesh and Titman.
- Many traders use support at prior resistance and pivot points to manage risk and improve timing, particularly in liquid markets.
- Charting software enables traders to backtest strategies, revealing which technical signals perform better in certain environments.
- Fibonacci ratios and Ichimoku cloud indicators often help in identifying key support resistance zones, especially in forex and futures contracts.
- Volume-based signals and trend continuation patterns such as flags or wedges can be helpful when confirmed by broader market indicators.
These strategies are also taught in professional courses like the New York Institute of Finance and validated by certifications such as the Chartered Market Technician (CMT).
Where Technical Analysis Falls Short
Technical analysis is a widely used approach, but it has well-documented limitations. Many of its tools are appealing in theory, yet fail to deliver consistent results when tested rigorously. In fact, several peer-reviewed studies have shown that commonly used technical indicators often underperform passive strategies or fail to generate alpha net of costs.
Here are some of the most important limitations:
- False patterns are frequent. Chart setups like the head and shoulders formation or support at prior resistance often appear meaningful, but large-scale statistical testing reveals mixed and unreliable predictive power. Many of these patterns are retrospective interpretations, not consistent forecasting tools.
- Macro events frequently override signals. Market-moving news, such as shifts in monetary policy, geopolitical events like Middle East tensions, or unexpected economic data, can negate chart-based setups within minutes. No chart can predict a central bank surprise or a sudden global shock.
- Context matters more than signals. Indicators such as Parabolic SAR, Zig Zag, or the Average Directional Index are highly sensitive to trend strength. They often perform poorly in sideways or low-volatility markets, where false signals increase and profitability drops.
- Lack of integration with fundamentals leads to blind spots. Relying solely on tools like Pivot points, Ichimoku Kinko Hyo, or Point and Figure charts without understanding key fundamentals such as earnings cycles, GDP growth, and inflation can lead to decisions that ignore the broader investment landscape.
- Machine-driven markets reduce edge. High-frequency trading systems and algorithmic models often react faster than human traders. Once-popular patterns become less effective as institutional systems exploit them before retail traders can act.
- Price patterns reflect sentiment, not causality. A trend line or Fibonacci level may coincide with price action, but it does not cause the market to move. Underlying factors such as liquidity flows, interest rate expectations, and earnings revisions ultimately drive market direction.
What the Research Says
A 2019 study published in The Journal of Financial Economics found that most technical trading rules fail to outperform a simple buy-and-hold strategy when adjusted for transaction costs. Similarly, research from the Review of Financial Studies concluded that the performance of many popular indicators deteriorates once tested on out-of-sample data or in different market regimes.
So, Does Technical Analysis Work?
Yes, but with major caveats.
Technical analysis can be effective, but only when used as part of a well-structured and disciplined approach. It’s not a magic formula for profits, but when applied correctly, it can offer clarity in uncertain markets.
At its best, technical analysis provides structure around market timing, risk management, and trend confirmation. It helps traders define entry and exit points, identify momentum shifts, and stay emotionally neutral – critical in fast-moving or volatile environments.
However, its real edge appears when combined with broader tools and frameworks. Some of the most effective pairings include:
- Macroeconomic Context – Technical signals are often filtered through the lens of interest rate trends, inflation data, employment reports, and central bank decisions. A textbook breakout on a chart can fail instantly if the Federal Reserve surprises the market. For example, rate hikes have historically compressed valuations across growth stocks, despite bullish technical setups.
- Fundamental Analysis – Pairing technical analysis with data from income statements, balance sheets, and free cash flow trends can help validate price movements. Using platforms like Gainify, which blend real-time earnings forecasts, PEG ratios, and technical overlays, adds another layer of conviction before executing a trade.
- News and Event Awareness – Real-time data from credible outlets such as Bloomberg, Reuters, or Yahoo Finance helps interpret when technical signals may become unreliable. Earnings surprises, geopolitical events, or changes in regulation can quickly negate even the strongest pattern setups.
Bottom Line:
Technical analysis works best as a component of a broader strategy, not as the strategy itself. Its strength lies in complementing macro and fundamental views, not replacing them. Traders who blend technical signals with context, confirmation, and risk control tend to outperform those who trade based solely on chart patterns.
Final Thought: Use It, But Don’t Worship It
Markets move based on human behavior, liquidity, macroeconomic forces, and investor narratives. Charts help you visualize those forces, but they do not drive them.
If you want to improve your use of technical analysis in real-world trading:
- Focus on context, not just patterns – A breakout on a chart means little if it occurs right before a major Fed announcement or earnings report.
- Treat both wins and losses as learning opportunities – Every trade provides feedback. Review your decisions objectively and learn from the results.
- Backtest and refine your approach constantly – Use quality trading platforms and historical market data to validate your strategy. Tools like TradingView, Gainify, and MetaTrader help you test ideas under real conditions.
- Understand the limits of technical indicators – No indicator is perfect. Combine your charts with macro awareness and solid risk management.
Technical analysis is not magic, and it is not fiction. It is a method that requires discipline, judgment, and continuous improvement. Use it with clarity, not as a shortcut.
FAQ: Does Technical Analysis Actually Work?
Q: Can technical analysis predict future prices accurately?
A: Not consistently. It can identify probabilities based on historical price patterns but cannot predict with certainty.
Q: Is technical analysis useful for long-term investing?
A: It is more useful for timing entries and exits, not for long-term valuation-based decisions.
Q: Are some chart types better than others?
A: Yes. Candlestick charts, bar charts, and OHLC charts provide more detail than line charts. Tools like Point and Figure can help filter out noise.
Q: Do professional analysts use technical analysis?
A: Yes, particularly in swing trading, forex, and short-term strategies. However, they often combine it with fundamental and macro analysis.
Q: What is the best way to start using technical analysis?
A: Start with basic tools like moving averages, support resistance, and volume analysis. Use platforms like TradingView Pro+ or eToro Demo Account to practice and test.