
Are stocks overvalued?
It’s one of the most important questions investors ask, especially during periods of strong performance in the American stock market. Valuation is not about market timing or predicting a bear market. It is about making investment decisions based on data, not hype.
The answer? Some stocks are overvalued, others are undervalued.
Understanding the current stock price in the context of valuation helps align your investment objective with a fair risk-adjusted return. Expensive stocks often dominate headlines, but many opportunities exist beneath the surface, particularly in underfollowed asset classes.
By using key valuation metrics such as forward P/E, forward Price-to-Revenue, EV/EBITDA, PEG ratio, dividend yield, and the Buffett Indicator (market cap to GDP), investors can assess whether a stock’s current price aligns with its long-term fundamentals.
These tools help filter out noise and anchor decision-making in data. Whether you’re an active trader seeking short-term signals or a long-term investor focused on asset allocation strategies, these valuation indicators provide a consistent framework for evaluating market opportunities.
What Does “Overvalued” Mean in the Stock Market?
A stock is considered overvalued when its current market price exceeds its fair value based on key financial indicators such as projected earnings, return on equity, dividend payments, and operational metrics like profit per employee. This means the stock price is not justified by the company’s fundamentals. Overvaluation is often driven by factors like investor enthusiasm, positive media sentiment, or extended periods of low interest rates that inflate valuation metrics.
To assess whether stocks or the broader market are overvalued, investors can rely on a range of valuation metrics:
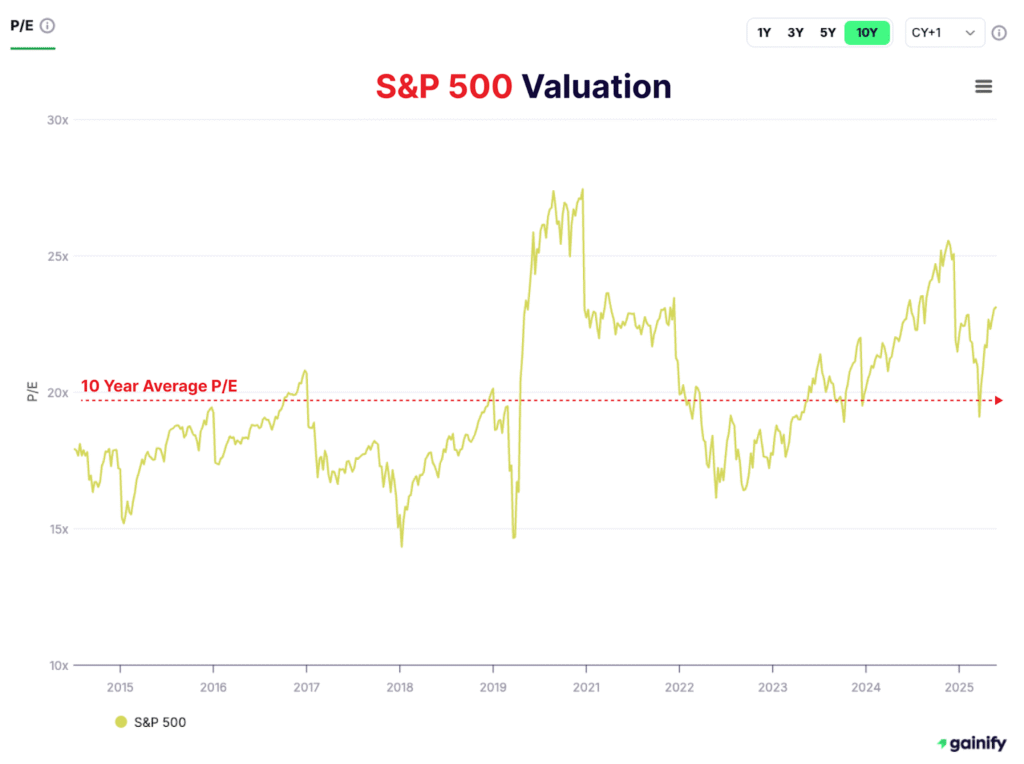
- Forward Price-to-Earnings (P/E): Shows how much investors are paying today for each dollar of expected earnings in the next 12 months. For example, the S&P 500 currently trades at 23.1 times forward earnings, compared to its 10-year average of 19.8 times. This suggests investors are pricing in above-average earnings growth or are willing to accept lower future returns.
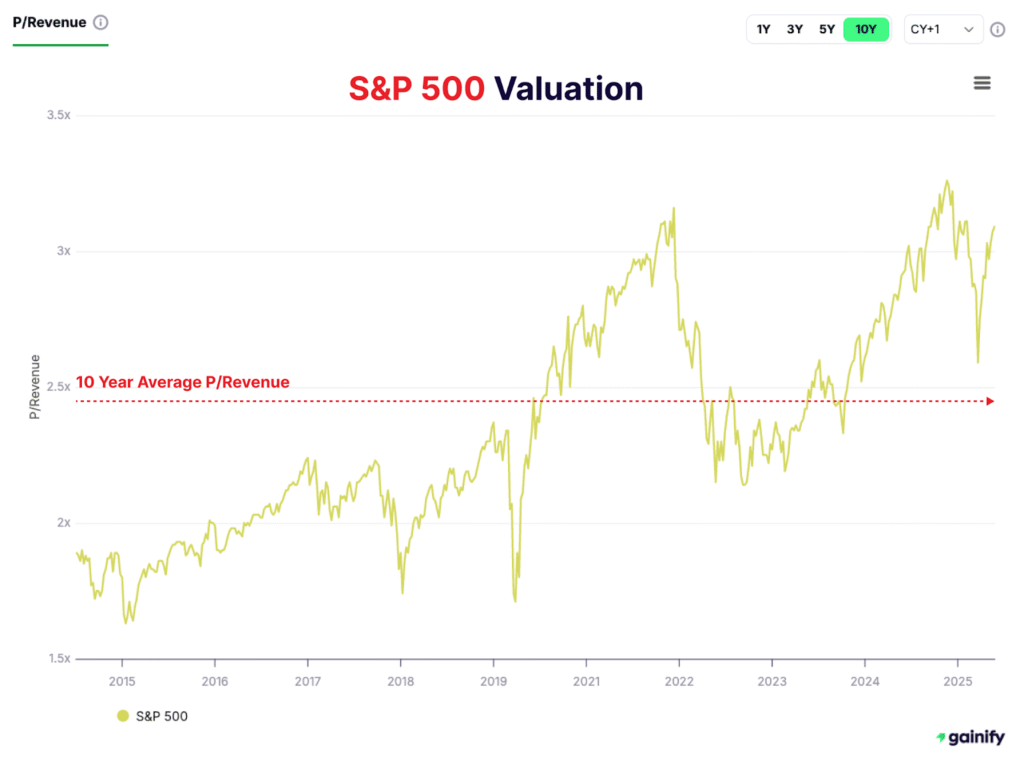
- Forward Price-to-Revenue: Useful for evaluating high-growth sectors like technology or digital healthcare where earnings may not yet be strong. At present, the S&P 500 trades at 3.1 times forward revenue, significantly higher than its 10-year average of 2.4 times. This signals rich valuations relative to historical norms.
- EV/EBITDA (Forward): A capital structure–neutral way to compare valuation across industries. The S&P 500 currently trades at 15.5 times forward EV/EBITDA, compared to a 10-year average of 12.5. This implies that investors are paying a premium for cash flow today versus the past decade.
- PEG Ratio: Combines price-to-earnings with earnings growth to give a more balanced view of valuation. A PEG well above 1.5 is often viewed as a warning sign that valuation is outpacing growth expectations, especially in crowded segments like AI and software.
- Dividend Yield: Helps evaluate total return by comparing stock income to bond yields. When the dividend yield falls well below the yield on the 10-year Treasury, it may indicate that stocks are expensive relative to their income potential.
- Market Cap to GDP (Buffett Indicator): Reflects total stock market value relative to economic output. A historically high reading suggests that the market may be pricing in more growth than the economy is likely to deliver, pointing toward broad overvaluation.
Each of these tools allows investors to make informed judgments about valuation. When used together, they offer a clearer picture of whether current prices reflect reality or are drifting into speculative territory.
What Drives Today’s Valuation Debate?
Assessing whether today’s market is overvalued means looking beyond ratios. Investors must evaluate the full landscape from policy signals to investor psychology and structural shifts in how companies generate returns. Several powerful forces are shaping the current valuation discussion:
- Artificial Intelligence Optimism – Stocks linked to AI, cloud infrastructure, and advanced semiconductors are now trading at levels that price in long-term dominance. Valuation multiples such as price-to-revenue and PEG ratio are near historic highs. While the growth story is compelling, many of these names are priced for perfection.
- Expectations of Lower Interest Rates – With inflation cooling and central banks shifting to a more dovish tone, investors are betting on lower rates in the near future. Lower discount rates make future earnings more valuable, supporting higher stock prices. However, this optimism depends heavily on inflation data and policy follow-through.
- The Rise of Passive Investing – Capital inflows into index funds continue to lift market leaders. Passive investing gives more weight to already expensive stocks, particularly in technology and healthcare. This effect can amplify overvaluation, as index constituents receive inflows regardless of earnings quality or valuation discipline.
- Asset-Light Business Models – Companies with digital-first, scalable operations often report high earnings with limited physical infrastructure. These asset-light firms tend to command higher multiples, which skews traditional metrics like price-to-book. As a result, investors rely more on forward-looking measures like EV/EBITDA and free cash flow yield to assess value.
- Policy Uncertainty and Macro Risks – Housing market softness, consumer debt levels, and geopolitical risks continue to weigh on sentiment. Future changes to tax policy, potential shifts in regulatory oversight, or global tensions could affect profitability across sectors. Investors should stay alert to how these changes impact earnings forecasts and valuations.
- Crowded Trades and Market Sentiment – Popular sectors such as AI, cybersecurity, and electric vehicles are heavily owned. Trader sentiment surveys show high levels of optimism, sometimes detached from fundamentals. In such an environment, even small disappointments can trigger sharp corrections.
In today’s market, overvaluation is not just about P/E ratios or dividend yields. It’s about the intersection of policy, psychology, technology, and monetary expectations. Investors must use multiple tools and remain grounded in both macro context and company fundamentals to assess true value.
A Contrarian Perspective
In heated markets, it is easy to get swept up by momentum. But seasoned investors understand that consistent long-term performance is often found in areas that receive less attention. A contrarian mindset is not about avoiding growth. It is about questioning consensus and identifying value before it becomes obvious.
Look Past Headlines
Financial media and analyst reports tend to highlight high-performing, high-visibility names. These stocks are often priced for perfection, leaving little margin for error. Contrarian investors focus on less crowded segments such as regional banks, industrial suppliers, or smaller asset-light service companies where valuations are more aligned with reality.
Earnings Yield Matters
Rather than focusing only on the P/E ratio, consider earnings yield, which is the inverse. Comparing a stock’s earnings yield to the 10-year Treasury rate can help determine whether the equity premium justifies the risk. In a low-rate environment, even moderate earnings yield can be attractive if supported by reliable and repeatable cash flows.
Bear Market Territory Is Not Always Bad
A sector or stock that has declined more than 20 percent from its peak may seem unattractive. However, if the core business remains strong, these pullbacks can offer compelling entry points. Historically, some of the best long-term opportunities have appeared when investor sentiment is weakest.
Assess Interest Payment Coverage and Leverage
In turbulent markets, a company’s ability to meet its interest obligations becomes a key indicator of financial health. Firms with strong interest coverage ratios, meaning they generate enough operating income to comfortably cover interest payments, are more likely to withstand economic stress and maintain flexibility. In contrast, highly leveraged companies with thin interest coverage may face refinancing challenges or be forced to cut spending during downturns.
Free Cash Flow Is Key
Earnings can be affected by accounting choices, but free cash flow tells a clearer story. Companies with stable and growing cash flow have more flexibility to reinvest, return capital to shareholders, or weather economic challenges. Investors should prioritize firms that consistently generate excess cash after expenses.
Watch Insider Buying Trends
When corporate insiders purchase shares in their own companies, it often reflects internal confidence that market prices undervalue the business. Monitoring insider buying during sell-offs can uncover companies poised for recovery or strategic shifts.
Think Beyond Borders
Opportunities are not confined to domestic large caps. Regional markets or international stocks often experience temporary dislocations due to currency fluctuations, political events, or regional slowdowns. For long-term investors, these situations can offer meaningful upside when fundamentals are still intact.
Conclusion: Take Action Based on Information, Not Emotion
Not every overvalued stock is a sell, and not every undervalued stock is a buy. Actual investment decisions should match your investment objective, financial situation, and risk tolerance.
The key is to anchor on fair value, not fear or hype. Stock prices driven by current share price trends or trader buzz often deviate from fair values. Use forward-looking metrics like PEG, EV/EBITDA, and dividend yield. Understand your asset class views and consult with a registered investment adviser when needed.
Smart investing means weighing the nominal returns against the potential loss of principal. With deeper analysis, investors can separate overvalued shares from hidden gems across the equity spectrum.
FAQs
Q: What is the Buffett Indicator?
A: The Buffett Indicator is the ratio of total stock market capitalization to a country’s gross domestic product (GDP). It is used as a macro-level valuation tool. When the ratio is significantly above historical averages, it can suggest the broader market is overvalued relative to the size of the economy.
Q: What defines an overvalued stock?
A: A stock is overvalued when its price exceeds the value supported by expected cash flows, earnings, and business fundamentals. It reflects optimism not yet backed by actual financial performance.
Q: Are expensive stocks always risky?
A: Not necessarily. While high valuation multiples may imply increased risk, some growth stocks justify premium pricing through strong future earnings potential, pricing power, or competitive advantages. Risk must always be viewed in context with fundamentals and forward outlook.
Q: Is the current price a reliable signal of value?
A: No. Market price alone doesn’t reflect intrinsic value. Forward-looking measures such as P/E, Price-to-Revenue, EV/EBITDA, PEG ratio, dividend yield offer a more complete picture of long-term value, especially for asset-light business models.
Q: Do dividends help protect against downside?
A: While dividends do not directly eliminate downside risk, a consistent and strong dividend yield can cushion total returns during periods of price volatility. Dividend-paying companies also tend to be more financially stable, offering resilience over long investment horizons.