
Most investors rely on the price-to-earnings (P/E) ratio when valuing stocks.
But on its own, the P/E can be misleading.
A company might appear cheap or expensive without any context on its future earnings growth. This is why investors often look to another metric that adjusts valuation for growth expectations.
What Is the PEG Ratio?
The PEG ratio, or Price/Earnings to Growth ratio, brings together two crucial elements: valuation and growth.
Instead of looking only at a company’s P/E ratio, it adjusts that multiple by factoring in the company’s expected earnings growth. This gives investors a more balanced picture of whether a stock is fairly priced.
In simple terms, it helps answer one key question: Is this valuation reasonable given how fast earnings are expected to grow?
The P/E ratio of any company that’s fairly priced will equal its earnings growth rate.”
Peter Lynch
Legendary investor
How to Calculate the PEG Ratio?
Calculating the PEG ratio is straightforward, but accuracy depends on using consistent inputs. You need two key inputs:
- Price-to-Earnings Ratio (P/E): This is calculated by dividing the current share price by the company’s earnings per share (EPS).
- For example, if Apple (AAPL) trades at $200 and its EPS is $7.25, the PEG ratio = 200/7.25 = 27.6x.
- Annual Earnings Per Share (EPS) Growth Rate: This is the projected compound annual earnings growth rate (CAGR) of the company’s earnings over a given period, typically 1 to 3 years. This figure is usually derived from analyst forecasts or company guidance.
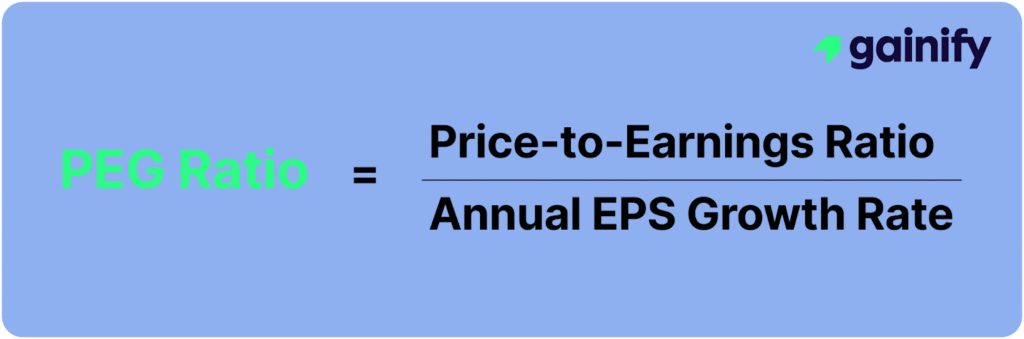
Once you have both, apply the formula:
PEG Ratio = Price-to-Earnings Ratio÷ Annual EPS Growth Rate
Example Calculation of Apple (AAPL):
- P/E Ratio = 27.6x
- Projected Earnings Per Share (EPS) Growth = 9.2%
PEG Ratio = 27.6 / 9.2 = 3.0
In this case, a PEG ratio of 3.0 suggests that the stock may be overvalued given its growth prospects.
It’s important to ensure that both the P/E and growth rate are based on the same time horizon and EPS source (e.g., froward 12-month EPS with 3-year future growth).
What Is a Good PEG Ratio?
A PEG ratio of around 1.0 – 2.0 is generally considered fair value, meaning a stock’s price is aligned with its expected earnings growth. Ratios below 1.0 suggest undervaluation, while above 2.0 can point to overvaluation.
Legendary investor Peter Lynch, former manager of the Fidelity Magellan Fund, popularized this approach. As he put it: “If the P/E is less than the growth rate, you may have found yourself a bargain.” That idea cemented the PEG ratio as a key tool for judging whether growth expectations justify valuation.
Lynch’s approach focused on identifying companies with both strong fundamentals and promising growth outlooks. He believed these businesses offered the best opportunities for long-term investment returns. This strategy made the PEG ratio an essential screening tool for growth investors.
Understanding what qualifies as a good PEG ratio requires context. Generally:
- A PEG below 1.0 suggests the stock may be undervalued relative to its growth potential.
- A PEG around 1.0 – 2.0 implies the stock is fairly valued.
- A PEG above 2.0 may indicate overvaluation, particularly if growth expectations do not improve.
However, interpretation varies across sectors. High-growth industries like technology often sustain higher PEG ratios due to elevated investor expectations for future performance. Therefore, while the PEG ratio offers a more comprehensive measure of valuation than the P/E ratio alone, it should be used alongside other financial metrics and industry benchmarks to gain a full picture of a stock’s investment potential.
How to Use the PEG Ratio Effectively
While the PEG ratio can help identify undervalued growth stocks, its true power lies in how it’s applied. To use it effectively, investors should treat the PEG ratio as a starting point, not a final answer. Here’s how to maximize its value in practical investment analysis:
A. Screen for Undervalued Growth Stocks
Start by filtering for companies with a PEG ratio below 1.0, especially those with strong balance sheets, consistent revenue growth, and expanding margins. A PEG under 1.0 suggests that a company’s stock may be undervalued relative to its earnings growth potential, often the sweet spot for growth-at-a-reasonable-price (GARP) investors.
Investor Insight: Ensure the low PEG isn’t driven by unsustainable earnings spikes or overly optimistic forecasts. Cross-check growth assumptions with historical trends and sector outlooks.
B. Compare Within the Same Sector
The PEG ratio is most meaningful when used in industry-relative comparisons. Different sectors have different growth norms and risk premiums. For instance, a PEG of 1.5 might be fair for a mature utility stock but high for a tech company expected to grow earnings at 30% annually.
Tip: Use the PEG to rank peers in the same industry to isolate those offering the best value for expected growth.
C. Combine PEG with Quality Metrics
A low PEG ratio is not enough. Combine it with fundamental indicators that assess business quality and financial health:
- Return on Invested Capital (ROIC): Is the company reinvesting profits wisely?
- Free Cash Flow (FCF): Does growth translate into actual cash?
- Revenue Growth Trends: Is top-line growth consistent or lumpy?
- Debt Levels: Is the growth coming at the expense of financial risk?
These additional metrics help validate whether a PEG below 1.0 truly represents a compelling opportunity or just a trap.
D. Evaluate the Growth Assumptions
A PEG ratio is only as reliable as the earnings growth estimates (not historical growth rates) it’s based on. Before acting on a seemingly attractive PEG, dig into the assumptions behind the forecast:
- Are they supported by business drivers (e.g., product launches, market expansion)?
- Do they factor in competitive threats or macro headwinds?
- Are they in line with consensus analyst views or overly aggressive?
High-quality companies tend to under-promise and over-deliver, whereas speculative firms may have inflated forecasts that lead to disappointment.
⚠ Limitations of the PEG Ratio
While the PEG ratio offers a more dynamic valuation lens by factoring in earnings growth, it is far from a flawless metric. Understanding its limitations is essential for making balanced investment decisions.
1. Heavily Dependent on Earnings Forecasts
One of the most significant drawbacks of the PEG ratio is its reliance on projected growth in earnings, which is inherently uncertain. Analyst estimates can vary widely and are frequently revised due to changes in market conditions, company performance, or macroeconomic trends. Overly optimistic or outdated projections can lead to misleading PEG valuations, making a stock appear cheaper (or more expensive) than it actually is.
Investor Tip: Always review multiple sources for growth projections and consider a range of scenarios (bull, base, bear cases) when interpreting PEG.
2. Short-Term Growth Focus
Most PEG calculations use a 1 to 3-year compound annual growth rate (CAGR) for EPS. While this horizon aligns with typical analyst coverage, it may fail to capture a company’s long-term growth trajectory, particularly for businesses with multi-year investment cycles or emerging technologies still ramping up.
This short-term lens can cause investors to overlook businesses with strong long-term competitive advantages or misinterpret temporary slowdowns as structural issues.
3. Distorted in Cyclical and Volatile Industries
In sectors like energy, materials, industrials, or semiconductors, earnings can fluctuate dramatically due to commodity prices, economic cycles, or global demand shifts. These earnings swings can result in PEG ratios that jump or plummet overnight, not because of changes in business quality, but due to the nature of the industry.
This makes PEG less reliable for evaluating companies with volatile or mean-reverting earnings patterns, where short-term growth figures can be misleading, especially in cases with negative earnings.
4. Ignores Capital Efficiency and Profit Quality
The PEG ratio does not take into account how efficiently a company reinvests its profits to generate future growth. A company may have strong EPS growth but could be burning capital inefficiently, masking deeper issues with return on capital, free cash flow, or margin sustainability.
For example, two companies may have identical PEG ratios, but one is growing through highly profitable organic expansion, while the other is relying on aggressive debt-fueled acquisitions. The PEG ratio alone wouldn’t differentiate between them.
5. Overlooks Qualitative Factors
PEG is a purely quantitative metric — it says nothing about the underlying quality of the business. It doesn’t capture critical intangibles such as:
- Strength of leadership and management execution
- Brand equity and customer loyalty
- Barriers to entry and competitive moat
- Regulatory risk or geopolitical exposure
These elements can make or break a company’s growth trajectory, and are often just as important as numerical indicators in investment analysis.
6. May Penalize High-Quality, Mature Companies
Many stable, cash-generating businesses (like consumer staples or utilities) naturally have lower EPS growth rates, especially compared to tech or biotech firms. PEG can unfairly penalize these companies by producing high ratios, even though they may offer reliable dividends, consistent margins, and low volatility — traits valued by income or conservative investors.
Real-World Application: PEG Ratio Trends in Mega Caps
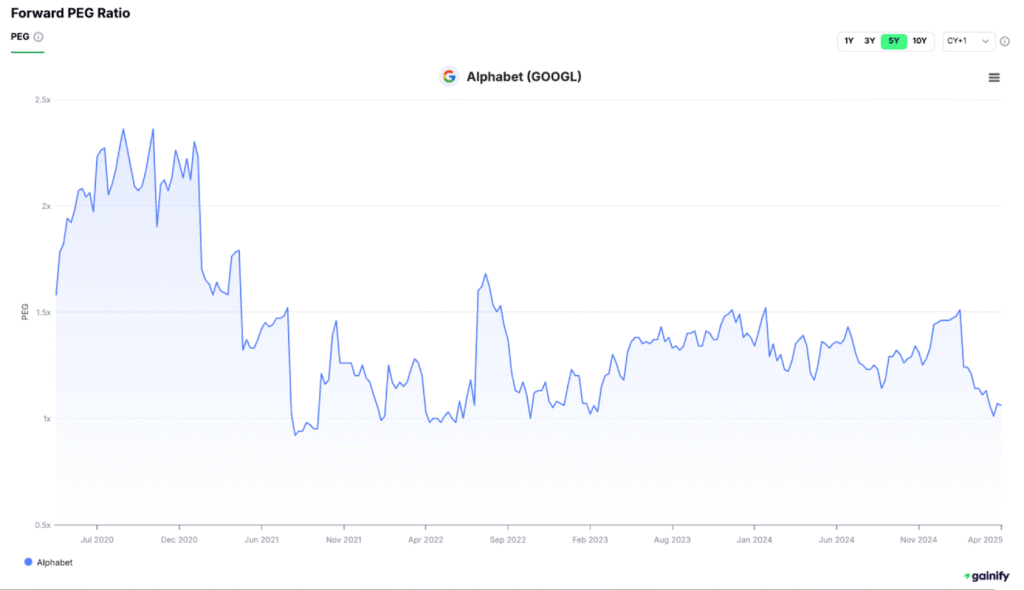
Now let’s shift from hypothetical to actual. Below, we analyze how the 1-year forward PEG ratios of major companies like Apple (NASDAQ:AAPL) and Alphabet (NASDAQ:GOOGL) have evolved over the past 5 years. These trends reveal how investor expectations, earnings growth outlooks, and valuation premiums change over time.
By charting the PEG ratios of these companies, investors can:
- Spot periods of potential undervaluation when growth was strong but pricing lagged
- Identify market conditions such as optimism or overvaluation
- Assess how earnings revisions impacted perceived growth-adjusted value
These charts serve as real-world examples of how PEG can be a dynamic, forward-looking valuation tool, especially when combined with a company’s growth narrative and business cycle position.
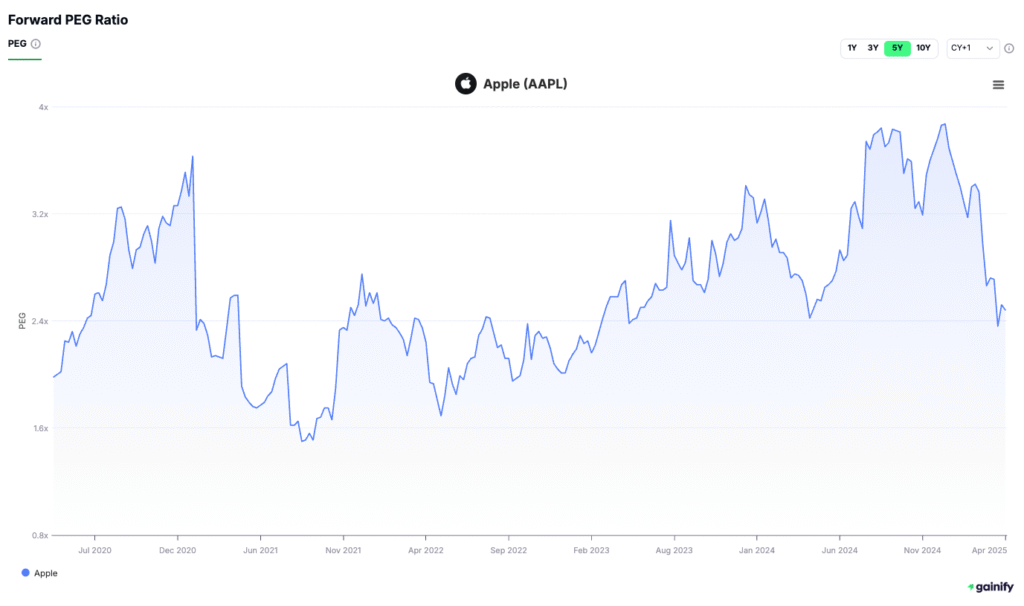
We can also observe how PEG ratios evolve over time in real companies. For example, Apple (AAPL)’s forward PEG ratio has fluctuated significantly over the past five years, peaking above 3.5x and recently trending toward 2.4x. This reflects shifting investor sentiment, multiple compression, and changes in growth expectations.
In contrast, Alphabet (GOOGL)’s PEG ratio has remained lower and more stable, generally ranging between 1.0x and 2.0x. This suggests the market has consistently priced GOOGL’s growth more modestly relative to Apple, possibly due to steadier earnings or more conservative growth forecasts.
These differences underscore why it’s essential to analyze PEG ratios in context, not just as standalone signals but as part of a dynamic valuation narrative shaped by earnings quality, industry dynamics, and investor sentiment.
Final Thoughts
The PEG ratio is a powerful enhancement of the traditional P/E ratio. By incorporating expected earnings growth, it provides investors with a more balanced perspective on valuation. This growth-adjusted metric is particularly useful for identifying stocks that may be undervalued relative to their future potential, making it a valuable tool for growth-oriented investors.
However, the PEG ratio should not be relied upon in isolation. Growth projections are inherently uncertain, and no single metric can capture the full picture of a company’s investment profile. To make well-informed decisions, investors should combine the PEG ratio with additional financial indicators such as return on invested capital (ROIC), free cash flow yield, and debt ratios. It is equally important to consider qualitative factors like competitive positioning, management quality, and industry trends.
Used thoughtfully and within a broader analytical framework, the PEG ratio can help uncover opportunities that traditional valuation tools might overlook. It supports a more disciplined and forward-looking investment approach that aligns valuation with sustainable growth.