The U.S. housing market enters 2026 at a critical point of transition. Structural undersupply, persistent demographic demand, and the growing influence of large public builders continue to support long-term fundamentals.
At the same time, affordability pressures, volatile builder sentiment, and uneven regional dynamics are shaping a market that rewards scale, operational discipline, and strong balance sheet management.
For investors, this creates one of the most analytically significant environments the homebuilding sector has experienced in years. Companies with deep land positions, efficient cost structures, and the ability to provide affordability through targeted incentives are best positioned to benefit from the current landscape.
This outlook provides a clear, research-driven framework for understanding the 2026 housing cycle and identifies eight homebuilding stocks that stand out as well positioned for the year ahead.
Highlights
- Structural undersupply remains the defining force in the U.S. housing market, supporting demand for new construction and reinforcing the advantage of large public builders.
- Affordability challenges are shaping buyer behavior, with mortgage rates, price-to-income ratios, and rising escrow costs creating a market where incentives and price engineering matter more than in prior cycles.
- Eight leading homebuilding stocks demonstrate strong multi-year positioning, supported by scale advantages, capital depth, disciplined land strategies, and diversified revenue models that can outperform across varying interest-rate environments.
Market Outlook for 2026
The U.S. housing market enters 2026 with a combination of structural demand strength and persistent affordability stress, creating a cycle defined more by capacity, capital, and regional asymmetry than by broad-based expansion. The underlying conditions favor large public builders that can operate at scale, manage payments through incentives, and maintain production in markets where private competitors are retreating.
Structural Undersupply and Controlled Supply Response
The national housing shortage remains significant, with estimates ranging from 2.5 million to 4 million units. Although construction activity improved modestly through 2024 and 2025, supply additions are not sufficient to close the gap.
Regional differences are pronounced as well. The Northeast and Midwest remain deeply undersupplied, while the Sun Belt has more active construction but still operates below pre-2019 inventory norms. Builders with sizable land positions and diversified geographic footprints hold an advantage in directing the pace and composition of new supply.
Affordability as the Primary Constraint
Affordability remains significantly stretched. The home-price-to-income ratio is above five times, far above the long-term average near four. Households earning seventy-five thousand dollars can afford only about one fifth of active U.S. listings, compared with nearly one half before the pandemic. Monthly ownership costs continue to rise due to higher property taxes and insurance premiums, which have increased roughly forty-five percent since 2019. Mortgage rates have eased from prior peaks but remain high enough to restrict mobility among existing homeowners and to limit entry-level purchasing power. These factors concentrate demand in the segment of buyers who can benefit from builder incentives or who possess unusually strong balance sheets.

Builder Sentiment Reflects Caution, Not Expansion
The NAHB and Wells Fargo Housing Market Index registered thirty-eight in November 2025, a level close to the lows seen over the past decade. This reading signals weak builder confidence and limited buyer activity. Price cuts and incentives remain widespread, which shows that demand is highly dependent on monthly affordability. Builders are relying on rate buydowns, more compact floor plans, and targeted incentives to keep absorption stable.

Regional Divergence Creates Distinct Opportunity Sets
Geographic performance remains highly uneven. States with structural underbuilding, such as New York and several Northeast metros, continue to experience rapid price appreciation even with limited transaction volume.
In contrast, Texas and other Sun Belt markets exhibit more balanced conditions due to higher construction capacity, stronger job growth, and more buildable land. These differences influence which builders have pricing power, which have volume leverage, and which are best positioned to deploy capital efficiently.
Industry Structure Favors Public Builders
Public builders continue to gain market share as private builders face rising financing costs, reduced access to credit, and elevated operational expenses. Large builders benefit from vertically integrated mortgage platforms, scale purchasing advantages, sophisticated land strategies, and the ability to deploy incentives at a level private competitors cannot match. This capital depth allows public builders to operate effectively in a market defined by affordability constraints and uneven demand.
Overall, 2026 is shaping into a cycle where demand remains supported by long-term demographic trends, but realized volume depends on the ability to manage affordability. The operating environment rewards scale, balance sheet strength, and disciplined land positioning. Public builders that excel in these areas are positioned to define sector performance in the year ahead.
8 Homebuilding Stocks to Watch in 2026
The 2026 housing landscape presents a complex mix of constrained inventory, uneven affordability, and selective demand strength across regional markets. Public builders with scale, capital flexibility, and diversified product strategies are positioned to outperform as private competitors continue to retrench.
Although builder sentiment remains subdued, operational discipline, controlled incentives, and targeted pricing strategies support throughput in well-positioned markets. Within this environment, eight homebuilding and construction-ecosystem companies stand out for their strategic advantages heading into 2026.
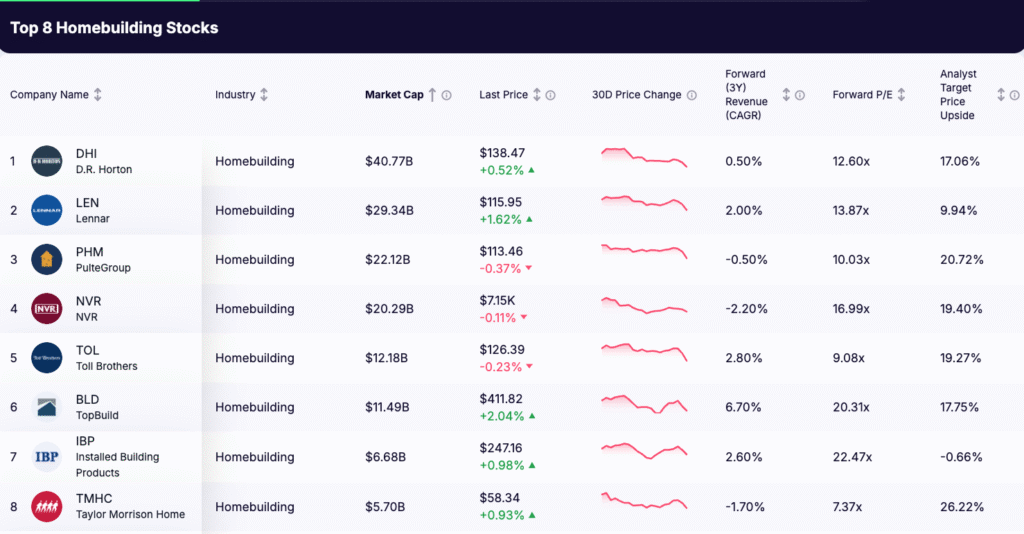
To screen stocks like that, you can use Gainify stock screener and in the Industry filter add Homebuilding.
1. D.R. Horton (DHI)
Industry: Homebuilding
Market Cap: 40.8 billion dollars
Last Price: 138.47 dollars
30-Day Price Change: -10.0%
Forward 3-Year Revenue CAGR: 0.50%
Forward P/E: 12.60x
Analyst Target Upside: 17.06%
The 2026 View: Scale Leadership and Operational Strength
D.R. Horton (DHI) enters 2026 as the most influential operator in the U.S. homebuilding sector. Its unmatched national footprint and disciplined execution in the entry-level segment give the company exceptional resilience in a rate-sensitive environment. Volume flexibility, superior cost control, and a highly integrated operating model allow DHI to protect throughput even when mortgage demand fluctuates.
Key 2026 Drivers
- Deep land position supporting multi-year visibility: DHI maintains the largest controlled and owned land pipeline in the public builder universe. This inventory advantage positions the company to respond quickly to regional demand shifts and protect margins through disciplined lot release management.
- Integrated mortgage platform enabling competitive payment structures: the builder-operated mortgage subsidiary allows DHI to offer rate buydowns and tailored financing packages. This is a critical competitive lever in a market where affordability remains a primary constraint.
- Strong absorption in high-migration markets: the company continues to benefit from elevated demand in Sun Belt and Mountain West metros where population inflows and job creation remain above the national average.
- Expansion into community-scale build-to-rent: DHI has expanded its presence in the build-to-rent channel, adding a recurring revenue dimension and increasing the optionality of finished inventory during periods of slower for-sale activity.
Outlook for 2026
D.R. Horton’s combination of scale, capital efficiency, and land depth positions it as one of the sector’s most reliable volume producers entering 2026. The company maintains strategic advantages that reinforce its leadership role in U.S. housing supply.

2. Lennar (LEN)
Industry: Homebuilding
Market Cap: 29.3 billion dollars
Last Price: 115.95 dollars
30-Day Price Change: -7.9%
Forward 3-Year Revenue CAGR: 2.00%
Forward P/E: 13.87x
Analyst Target Upside: 9.94%
The 2026 View: Asset-Light Discipline and Capital Partnership Strength
Lennar (LEN) enters 2026 as one of the most capital-efficient operators in the homebuilding sector. Its land-light strategy reduces balance sheet risk, supports returns across cycles, and enhances flexibility in a demand environment that remains sensitive to mortgage-rate movements. The company’s deep network of institutional partners in both rental and land development channels provides multi-year earnings visibility and a diversified monetization path.
Key 2026 Drivers
- Land-light strategy preserving margin and reducing volatility: Lennar continues to prioritize options over ownership. This approach limits capital intensity, enhances ROE durability, and lowers exposure to land-related impairments during periods of slower absorption.
- Institutional partnerships driving recurring demand: Structural growth in build-to-rent (BTR) creates a consistent outlet for inventory. Lennar’s long-standing relationships with institutional capital providers reinforce predictable volume placement.
- Technology-enabled cost efficiencies: Proprietary digital platforms and standardized construction workflows support industry-leading cycle times and cost control, improving margin resilience even when selling incentives rise.
- Disciplined land acquisition and underwriting: Lennar continues to skew land investment toward shorter-duration and higher-turn assets, maintaining strategic optionality in a shifting rate landscape.
Outlook for 2026
Lennar’s operating model is designed for both resilience and capital efficiency. Its combination of land-light execution, strong institutional demand channels, and cost-focused operational systems positions the company as one of the homebuilding sector’s most dependable compounders heading into 2026.

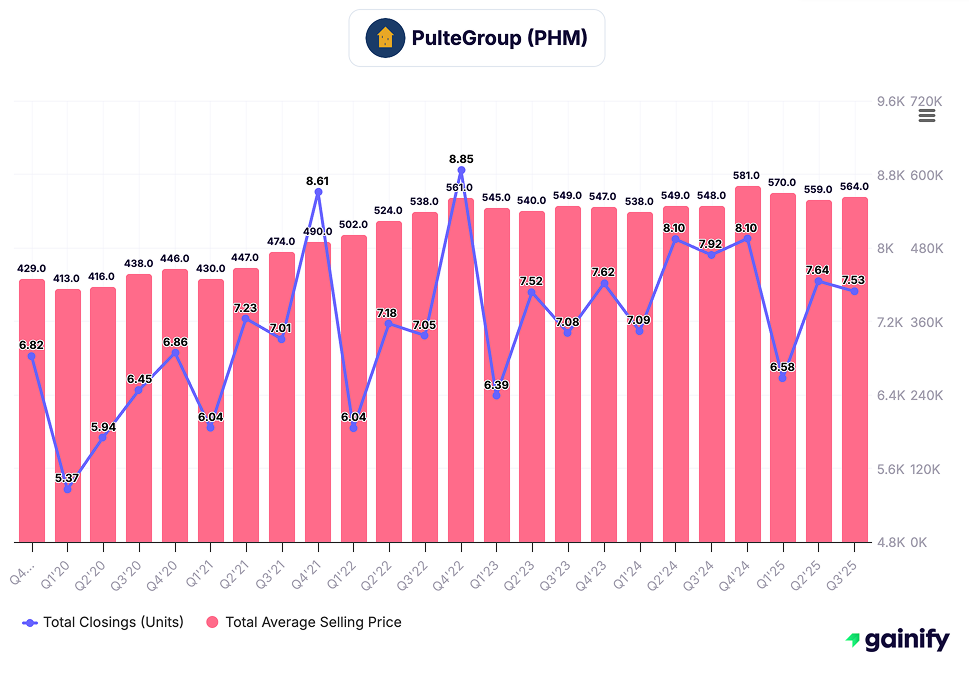
3. PulteGroup (PHM)
Industry: Homebuilding
Market Cap: 22.1 billion dollars
Last Price: 113.46 dollars
30-Day Price Change: -8.0%
Forward 3-Year Revenue CAGR: -0.5%
Forward P/E: 10.03x
Analyst Target Upside: 20.7%
The 2026 View: Margin Leadership Supported by Balanced Product Mix
PulteGroup (PHM) enters 2026 with one of the strongest margin profiles in the U.S. homebuilding sector. The company benefits from a diversified footprint across first-time buyers, move-up buyers, and its well-established Active Adult communities. This balanced mix helps stabilize absorption rates and protects profitability across varying demand conditions. PHM’s disciplined land acquisition strategy and tight cost management further support consistent returns even as market affordability remains strained.
Key 2026 Drivers
- Active Adult demand supporting volume and margins: Demographic trends continue to favor PHM’s age-targeted communities, which attract buyers less sensitive to mortgage-rate volatility and often supported by equity-rich relocations.
- Disciplined land investment and cycle management: PulteGroup maintains a measured land ownership strategy, with a focus on shorter-duration positions and rigorous underwriting. This approach supports higher returns on invested capital and reduces exposure to slower-turn assets.
- Pricing leverage in constrained supply markets: PHM operates in several metropolitan areas with structurally limited resale inventory, allowing the company to sustain pricing power even as incentives rise elsewhere in the sector.
- Cost control and operational consistency: The company continues to execute with tight control over construction costs and cycle times. This operational discipline has been a key factor in PHM’s sector-leading gross and operating margins.
Outlook for 2026
PulteGroup enters 2026 with a combination of diversified demand exposure, disciplined land management, and strong profitability metrics. Its balanced customer mix and consistent execution position the company as one of the sector’s most margin-resilient operators in an environment where affordability constraints and rate sensitivity remain central themes.
4. NVR (NVR)
Industry: Homebuilding
Market Cap: 22.7 billion dollars
Last Price: 6,202.77 dollars
30-Day Price Change: -6.9%
Forward 3-Year Revenue CAGR: -0.2%
Forward P/E: 17.59x
Analyst Target Upside: 5.11%
The 2026 View: Low-Risk Model With Consistent Return Leadership
NVR enters 2026 with one of the most conservative operating models in the U.S. homebuilding industry. The company’s strict land-light strategy – acquiring finished lots through purchase agreements rather than owning large land banks – limits balance sheet exposure and reduces cyclicality. This approach has historically produced industry-leading return on equity and stable earnings performance, even in periods of declining housing sentiment.
Key 2026 Drivers
- Land-light structure minimizing capital risk: NVR continues to rely on lot purchase agreements rather than owning or developing land. This significantly reduces inventory risk, improves capital efficiency, and insulates the balance sheet when market absorption slows.
- Superior return on equity consistency: The company’s low capital intensity supports some of the highest ROE levels in the sector, even when volume growth moderates.
- Operational strength in infill and established East Coast markets: NVR maintains concentrated exposure to markets with stable employment bases and constrained land availability. These markets tend to exhibit less severe price volatility and provide more predictable traffic patterns.
- Strong cost control and predictable build cycles: NVR’s standardized construction processes and tight operating discipline contribute to high earnings visibility and reduced exposure to cost overruns.
Outlook for 2026
NVR enters 2026 positioned as the sector’s most defensive operator. Its land-light model, high capital efficiency, and focus on established markets support steady performance in environments where affordability and sentiment remain fragile. For investors prioritizing earnings stability and disciplined exposure to the housing cycle, NVR remains one of the strongest risk-adjusted profiles in the public builder universe.

5. Toll Brothers (TOL)
Industry: Homebuilding
Market Cap: 11.9 billion dollars
Last Price: 143.62 dollars
30-Day Price Change: -6.9%
Forward 3-Year Revenue CAGR: 2.90%
Forward P/E: 9.63x
Analyst Target Upside: 16.13%
The 2026 View: Luxury Demand Supported by Wealth Concentration and Low Supply
Toll Brothers (TOL) enters 2026 as the leading U.S. luxury homebuilder, supported by a customer base that is less sensitive to mortgage-rate movements and more reliant on cash transactions or substantial equity contributions. Limited supply in affluent markets, strong household balance sheets, and ongoing demand for high-quality design and urban-adjacent locations continue to support the segment. Toll’s diversified luxury portfolio, including attached, urban, and rental offerings, provides additional stability.
Key 2026 Drivers
- High proportion of cash and equity-rich buyers: A large share of Toll’s customers purchase with minimal mortgage dependence, reducing sensitivity to rate fluctuations and stabilizing absorption even when affordability conditions tighten.
- Strong design and architectural premium: TOL maintains the highest-priced product line among large public builders, supported by customization, higher-end finishes, and differentiated architectural offerings.
- Limited inventory in affluent markets: Many Toll communities operate in supply-constrained metro areas where zoning, land scarcity, and regulatory friction support pricing power.
- Expansion of attached and urban luxury products: Toll continues to diversify beyond traditional detached luxury homes, increasing exposure to markets with strong professional and dual-income buyers.
- Growing luxury rental portfolio: The company’s development of high-end rental communities adds diversification and enhances earnings visibility across cycles.
Outlook for 2026
Toll Brothers enters 2026 with strong positioning in the luxury segment, supported by a financially resilient buyer base and structurally constrained supply in its core markets. Its design leadership, community locations, and product diversification reinforce a favorable outlook, even in a rate-sensitive broader housing market.

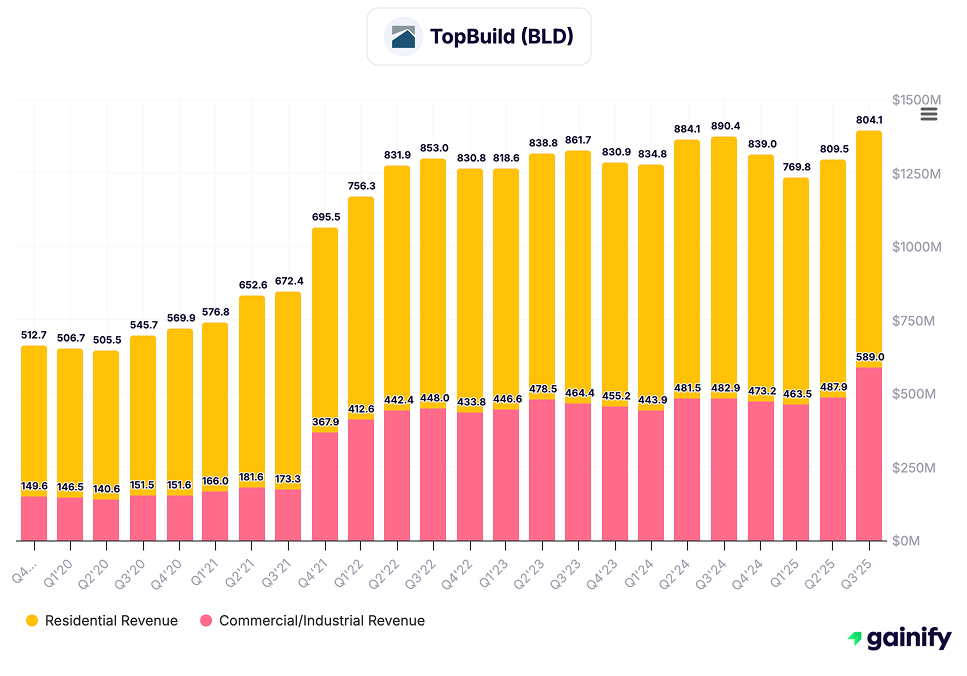
6. TopBuild (BLD)
Industry: Building Products and Installation
Market Cap: 12.2 billion dollars
Last Price: 433.53 dollars
30-Day Price Change: -6.6%
Forward 3-Year Revenue CAGR: 3.2%
Forward P/E: 22.0x
Analyst Target Upside: 8.5%
The 2026 View: Energy-Efficiency Tailwinds and Installation Scale
TopBuild (BLD) enters 2026 as one of the most important companies in the building-products ecosystem, supplying and installing insulation and related materials across residential, commercial, and industrial markets. Its business is closely aligned with long-term themes such as rising energy-efficiency standards, increased insulation requirements, and steady retrofit demand. With national scale, strong pricing discipline, and a proven acquisition strategy, TopBuild maintains a structurally advantaged position in both new construction and repair-and-remodel channels.
Key 2026 Drivers
- Energy-efficiency and regulatory momentum: Strengthening building codes and higher insulation standards support increased product intensity across residential and commercial projects, providing a multi-year demand tailwind.
- Balanced end-market exposure: The company serves single-family, multifamily, commercial, and retrofit channels, reducing reliance on any one segment of the construction cycle and smoothing earnings through macro fluctuations.
- Scale-driven cost advantages: TopBuild’s nationwide installation footprint and procurement network support margin consistency through purchasing leverage, operational efficiency, and dense route coverage.
- Acquisition strategy expanding geographic and product reach: The company has a long track record of disciplined acquisitions that broaden its presence in high-growth regions and deepen its offerings across multiple building-envelope categories.
- Pricing power in key materials categories: Strong supplier relationships and differentiated service capabilities help maintain pricing discipline even when material-cost volatility increases.
Outlook for 2026
TopBuild enters 2026 with strong structural positioning at the intersection of construction activity and efficiency-driven demand. Its scale, regulatory alignment, and multi-channel exposure provide a resilient foundation for growth. For investors seeking participation in long-term energy-efficiency and building-envelope trends, TopBuild offers a durable and strategically important platform within the broader construction ecosystem.
7. Installed Building Products (IBP)
Industry: Building Products and Installation
Market Cap: 6.1 billion dollars
Last Price: 210.12 dollars
30-Day Price Change: -5.1%
Forward 3-Year Revenue CAGR: 4.1%
Forward P/E: 21.4x
Analyst Target Upside: 9.8%
The 2026 View: Expansion Through M&A and Multi-Segment Diversification
Installed Building Products (IBP) enters 2026 as one of the largest installers of insulation, garage doors, gutters, roofing, and other building-envelope components across the United States. The company’s model is driven by a steady pipeline of acquisitions, diversified service lines, and exposure to both new housing construction and repair-and-replacement markets. This combination creates a resilient revenue profile that benefits from long-term housing demand as well as ongoing maintenance and remodeling cycles.
Key 2026 Drivers
- Acquisition-driven growth strategy: IBP maintains one of the most active M&A pipelines in the building-products installation sector. These acquisitions expand market share, broaden geographic coverage, and add specialized service categories with attractive margin profiles.
- Diversified revenue across multiple installation categories: Beyond insulation, IBP generates revenue from garage doors, gutters, siding, waterproofing, shelving, and roofing. This diversification reduces dependence on any single construction material or housing segment.
- Exposure to both new construction and replacement cycles: IBP benefits from steady demand tied to single-family and multifamily construction, while its repair-and-replacement services provide year-round activity and help stabilize results when single-family starts soften.
- Strong pricing power in specialty categories: Many of IBP’s product lines operate in niche segments with limited competition, supporting pricing discipline and attractive margin characteristics.
- Operational efficiencies through scale: As the company grows through acquisitions, it gains purchasing leverage, stronger labor deployment capabilities, and improved route density — all contributing to margin expansion.
Outlook for 2026
Installed Building Products enters 2026 with a well-balanced combination of acquisition momentum, category diversification, and exposure to multiple construction cycles. Its ability to integrate acquisitions effectively, maintain strong margins, and operate across a wide range of building-envelope services positions the company as a durable multi-year growth story within the broader construction and housing ecosystem.

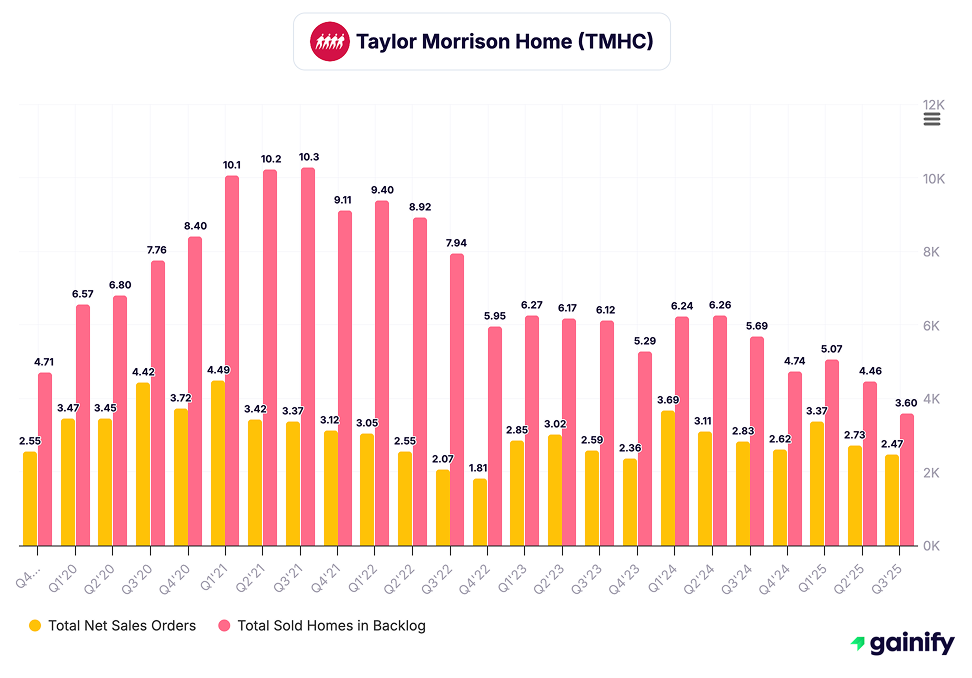
8. Taylor Morrison (TMHC)
Industry: Homebuilding
Market Cap: 6.5 billion dollars
Last Price: 59.84 dollars
30-Day Price Change: -6.1%
Forward 3-Year Revenue CAGR: 1.1%
Forward P/E: 8.2x
Analyst Target Upside: 18.4%
The 2026 View: Improving Fundamentals and Undervalued Relative Positioning
Taylor Morrison (TMHC) enters 2026 as a well-positioned operator with improving margins, a strengthening balance sheet, and expanding community count. The company benefits from a balanced mix of entry-level, move-up, and resort-lifestyle offerings, providing exposure to multiple demand drivers. While TMHC trades at a valuation discount relative to several peers, its operational execution, land discipline, and growing presence in build-to-rent and single-family rental channels point to a more constructive outlook heading into 2026.
Key 2026 Drivers
- Expanding community count supporting volume growth: Taylor Morrison is increasing its active community base, which provides a clearer path to sustained volume performance as new supply comes online in high-demand markets.
- Strengthening balance sheet and disciplined capital allocation: Continued deleveraging and measured land investment reinforce financial flexibility and support more consistent earnings performance across rate cycles.
- Advancing build-to-rent and rental platform execution: TMHC has increased its participation in rental-oriented strategies, broadening revenue streams and creating additional optionality for inventory that benefits from institutional demand.
- Margin stabilization through refined product mix: The company has taken steps to adjust its product positioning toward faster-turn and more resilient price points. These refinements support margin stability even as incentives remain elevated across the sector.
- Geographic exposure to strong Sun Belt and Mountain West markets: TMHC maintains a significant footprint in regions benefiting from population inflows and favorable long-term housing fundamentals.
Outlook for 2026
Taylor Morrison enters 2026 as a builder with improving operational momentum and a valuation that does not fully reflect its underlying fundamentals. Strengthening margins, disciplined land strategy, and growing rental-channel participation position the company to deliver relative outperformance as market conditions stabilize. TMHC represents a compelling opportunity for investors seeking both value and improving execution within the homebuilding sector.
Consolidated 2026 Investment Thesis
- Structural undersupply remains the defining force in U.S. housing, supporting demand across price points and reinforcing the advantage of builders with scale, land depth, and efficient distribution networks.
- Rate ceilings are no longer fully suppressing demand, as builders increasingly rely on mortgage buydowns, targeted incentives, and smaller floor plans to preserve payment affordability. Demographic drivers, including household formation and migration flows, continue to provide underlying support.
- Public builders are gaining share as private builders retreat, a trend driven by tighter financing conditions, higher capital requirements, and the balance sheet strength of national operators. This shift is accelerating into 2026, giving large public builders greater control over production and pricing discipline.
- Build-to-rent is moving from a supplemental strategy to a core business line. Institutional capital remains active, providing a consistent demand channel that supports absorption and creates recurring revenue opportunities.
- Sun Belt markets continue to deliver superior growth, supported by population inflows, employment expansion, and lower regulatory barriers. These regions remain the primary drivers of volume and margin outperformance within the sector.
- Margins are more resilient than in past cycles, supported by improved construction efficiencies, tighter cost management, standardized building platforms, and the accelerated adoption of tech-enabled processes.
Final Summary
By 2026, U.S. homebuilding stocks operate in an environment defined by scarce supply, disciplined competition, strong demographic support, and increasingly diversified revenue channels. The leading builders — D.R. Horton, Lennar, PulteGroup, NVR, Toll Brothers, TopBuild, Installed Building Products, and Taylor Morrison — are positioned to generate durable economic value through scale advantages, strategic land management, operational consistency, and exposure to the strongest demand corridors in the country.
Homebuilding remains one of the most fundamentally supported equity themes for 2026 and the years that follow.