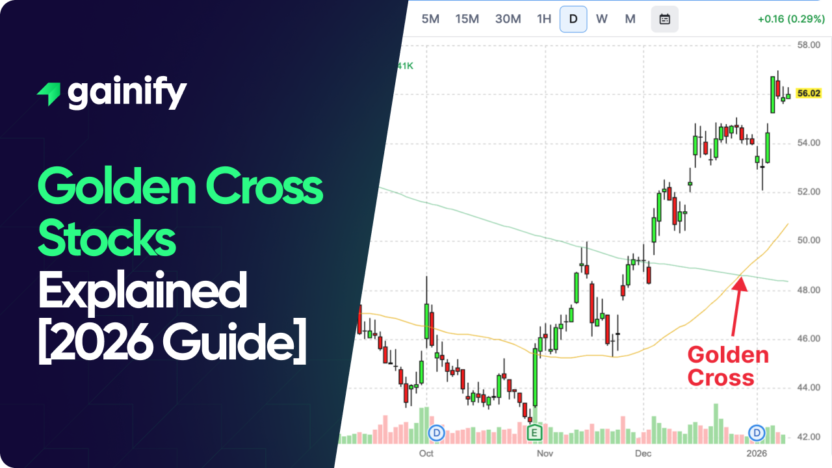

The golden cross is one of the most widely followed bullish signals in technical analysis, yet it is often misunderstood. Many investors associate it with the start of major rallies or treat it as a green light to buy immediately. In reality, the golden cross is neither a prediction nor a timing tool. It is a confirmation signal that reflects improving trend conditions already underway.
At its core, the golden cross does not forecast future gains. It does not guarantee higher prices. Instead, it signals that short-term momentum has strengthened enough to realign with the long-term trend.
As of January 2026, golden crosses are appearing across several large-cap stocks. In total, eight companies with market capitalizations above $50 billion have recently triggered a confirmed golden cross. That breadth makes the signal especially useful, not as a promise of upside, but as a way to identify where market conditions are stabilizing and improving.
This article explains how golden cross stocks work, how the signal forms, how it compares to the death cross, and how professional investors interpret it. Using current examples from January 2026, including Bristol-Myers Squibb and Vertex Pharmaceuticals, we examine what the golden cross tends to indicate, when it matters most, and where its limitations lie.
Key Takeaways on Golden Cross Stocks
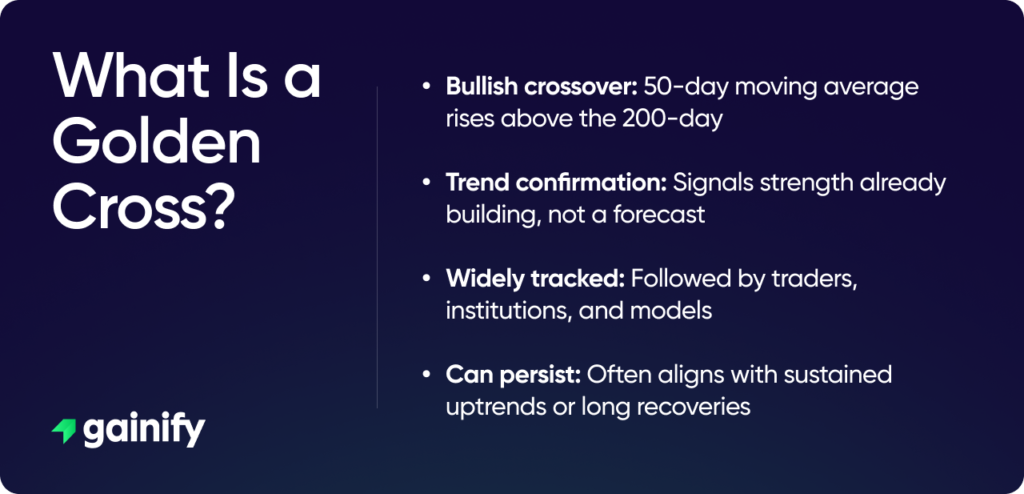
- The golden cross is a trend confirmation, not a prediction. It reflects strength that has already developed rather than forecasting future price moves.
- Context matters more than the signal itself. A golden cross can confirm recovery, continuation, or simple stabilization depending on market structure.
- Broad participation is meaningful. When multiple large-cap stocks trigger golden crosses, it often reflects improving market conditions rather than isolated stock-specific moves.
What Is a Golden Cross and How Does It Form?
A golden cross occurs when a stock’s 50-day moving average rises above its 200-day moving average. These two averages represent different views of price behavior. The 50-day tracks recent momentum and short-term trading activity, while the 200-day reflects the long-term trend that institutions and long-only investors closely monitor.
When the shorter-term average crosses above the longer-term one, it signals that strength has persisted long enough to influence the broader trend. This is not a sudden event. It is the result of sustained improvement in price behavior becoming visible on the chart.
That distinction is critical. A golden cross does not predict a rally, nor does it signal that a stock will continue rising indefinitely. It simply confirms that the trend has already improved.
Why the Golden Cross Is a Lagging Signal by Design
Like all moving-average-based indicators, the golden cross is built entirely from past prices. Moving averages respond to price movement rather than anticipate it. As a result, every golden cross appears after a recovery has already begun.
This is where many investors make mistakes. Buying solely because a golden cross appears often means entering after a significant portion of the initial rebound has already occurred. The earlier signals usually appeared when price stabilized, reclaimed support, or stopped making lower lows.
Professional investors understand this limitation. They do not use the golden cross as a trigger. Instead, they use it as confirmation that trend conditions have shifted and that downside risk has likely diminished.
Golden Cross vs Death Cross: Understanding the Full Cycle
The golden cross is the inverse of the death cross, but both share the same structural limitation: they are backward-looking.
A death cross appears after weakness has already developed. A golden cross appears after strength has already emerged. Neither predicts what happens next.
Instead, these signals describe whether short-term momentum is aligned with or working against the long-term trend.
Golden Cross vs Death Cross: Key Differences
Feature | Golden Cross | Death Cross |
Definition | 50-day MA rises above 200-day MA | 50-day MA falls below 200-day MA |
What it reflects | Trend improvement already underway | Trend deterioration already in place |
Timing | Lagging signal after recovery | Lagging signal after decline |
Typical context | Stabilization or strengthening | Weakening or defensive phase |
Common reaction | Optimism, confirmation | Caution, risk reduction |
Predictive power | Does not guarantee gains | Does not guarantee losses |
Best use | Trend validation | Risk management |
Why Golden Crosses Still Matter in 2026
Even though the golden cross is a lagging signal, it remains relevant because markets are driven by behavior as much as fundamentals. Many institutional strategies, trend-following systems, and risk frameworks monitor the same moving averages. When a golden cross appears, it often influences positioning decisions across a wide range of market participants.
In practice, the signal frequently aligns with rising confidence and improving liquidity, as investors become more willing to hold risk or rebuild exposure. It often reflects a shift away from defensive positioning toward a more constructive stance, even if enthusiasm remains measured.
This is where the golden cross becomes most useful. In weaker environments, price tends to struggle below a falling 200-day moving average. In healthier conditions, pullbacks above a rising 200-day are more likely to be bought. The golden cross often appears near this transition, helping investors recognize when market dynamics are improving.
Why Not All Golden Cross Stocks Are the Same
One of the most common mistakes investors make is treating every golden cross as equally meaningful. Context determines whether the signal adds insight or noise, and without it the crossover alone can be misleading.
Some golden crosses confirm genuine recoveries after prolonged weakness, where selling pressure has eased and demand is steadily improving. Others occur during sideways or volatile markets, where frequent moving-average crossovers lack follow-through and offer little guidance.
Because of this, experienced investors never focus on the crossover alone. They examine price structure, volume behavior, support and resistance levels, and the slope of the 200-day moving average to judge whether the signal reflects sustainable improvement or temporary strength.
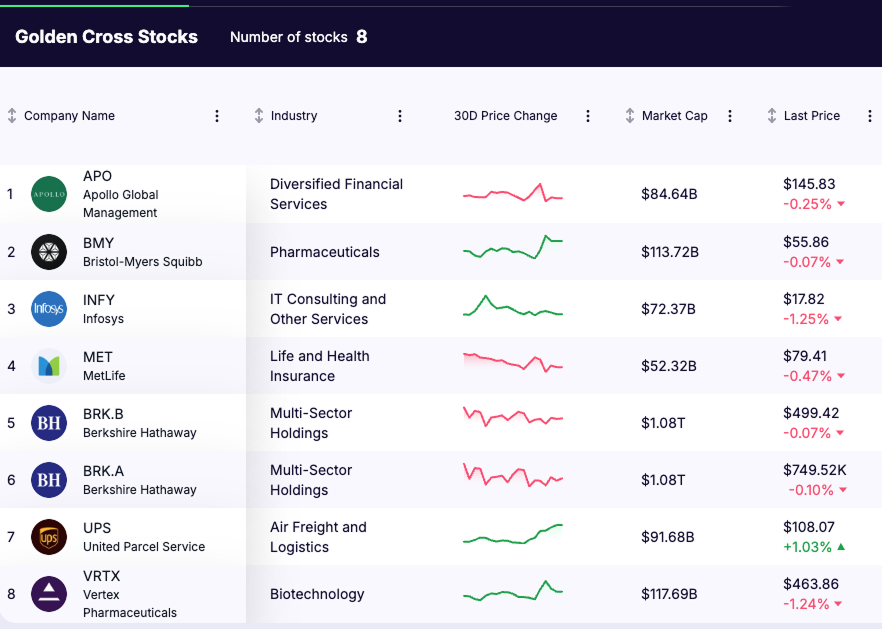
Large-Cap Golden Cross Stocks ($50B+) as of January 2026
Below is a current list of large-cap stocks that have recently triggered a confirmed golden cross as of January 2026:
- Apollo Global Management (NYSE: APO)
- Bristol-Myers Squibb (NYSE: BMY)
- Berkshire Hathaway Class A (NYSE: BRK.A)
- Berkshire Hathaway Class B (NYSE: BRK.B)
- Infosys ADR (NYSE: INFY)
- MetLife (NYSE: MET)
- United Parcel Service (NYSE: UPS)
- Vertex Pharmaceuticals (NASDAQ: VRTX)
This list spans defensive and cyclical sectors, suggesting selective improvement rather than broad speculative behavior.
Case Studies: Bristol-Myers Squibb and Vertex Pharmaceuticals (January 2026)
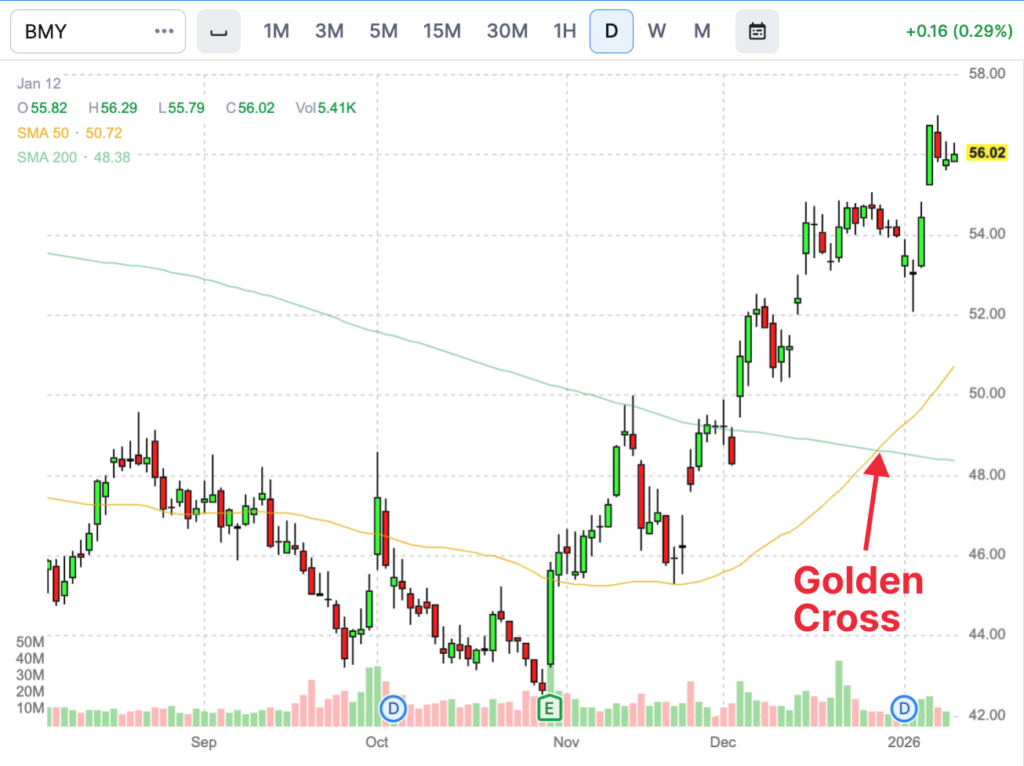
Bristol-Myers Squibb (BMY) – Golden Cross After Prolonged Weakness
Bristol-Myers Squibb’s golden cross formed after an extended period of underperformance. Price stabilized following a multi-month decline, downside momentum slowed, and selling pressure gradually diminished. As higher lows began to develop, the 50-day moving average turned upward and crossed above the 200-day.
In this case, the signal reflects trend repair rather than strong upside momentum. The 200-day moving average was flattening instead of accelerating higher, indicating stabilization and improving risk conditions rather than the start of a powerful uptrend. For long-term investors, this type of golden cross often signals reduced downside risk and improving structure, not immediate breakout potential.
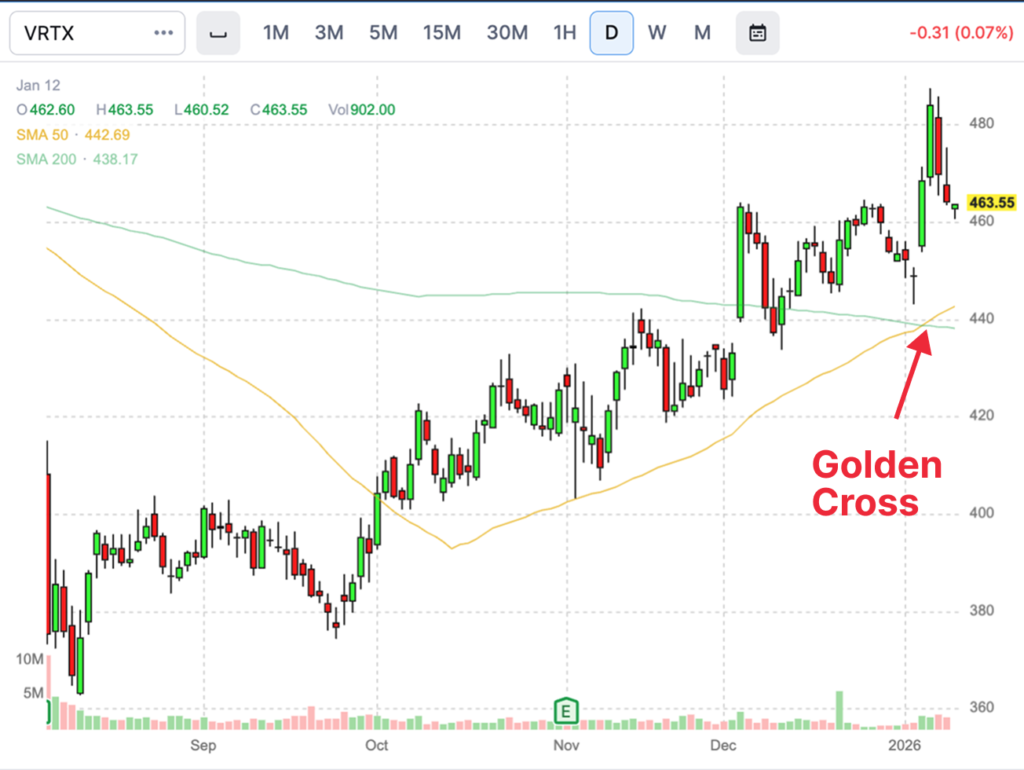
Vertex Pharmaceuticals (VRTX) – Golden Cross Confirming Strength
Vertex Pharmaceuticals’ golden cross emerged in a markedly different context. Price remained above key support levels, the 200-day moving average was already rising, and the stock displayed consistent relative strength throughout the period.
Here, the golden cross served as trend validation rather than recovery. Short-term momentum strengthened enough to realign with an already healthy long-term trend. This type of golden cross is typically associated with leadership stocks, where the signal reinforces existing strength instead of signaling a turnaround.
How Long-Term Investors Should Interpret Golden Cross Stocks
For long-term investors, a golden cross is not an automatic buy signal.
Instead, it acts as a confirmation checkpoint within a broader investment process.
The signal suggests that trend conditions have improved enough to justify patience, continued exposure, or selective accumulation when supported by fundamentals and price structure.
Many high-quality stocks experience golden crosses during periods of stabilization rather than rapid expansion. In these cases, the signal reflects risk normalization, not guaranteed upside. A golden cross does not ensure future gains. It simply indicates that the market environment has become more constructive and that downside risk has likely diminished relative to prior conditions.
Limitations of Using Golden Crosses in Stock Analysis
Despite its popularity, the golden cross has meaningful limitations. It is a lagging indicator, which means it often appears only after a substantial portion of a recovery has already occurred.
In range-bound or volatile markets, moving averages can cross frequently without producing a sustained trend, leading to false or low-quality signals.
The golden cross also provides no guidance on magnitude or duration. It does not indicate how far a stock might rise, how long strength may persist, or where meaningful resistance may emerge. Without confirmation from price behavior, volume trends, and broader market context, the signal lacks sufficient depth on its own.
For this reason, professional investors rarely rely on golden crosses in isolation. They treat the signal as one input among many, not as a standalone decision-making tool.
How to Identify a Golden Cross on a Stock Chart
Identifying a golden cross is straightforward. Begin by applying a 50-day moving average and a 200-day moving average to a stock’s price chart. A golden cross occurs at the point where the 50-day moving average crosses above the 200-day moving average.
However, proper identification goes beyond spotting the crossover. Investors should evaluate whether price is holding above both averages, whether the 200-day moving average is rising or flattening, and how price behaves in the weeks following the signal. Sustained trading above a rising 200-day average strengthens the signal, while quick reversals or failure to hold support reduce its reliability.
Final Thoughts: What Golden Cross Stocks Really Tell Investors
The golden cross is not a promise of gains. It is a confirmation that trend conditions have improved. Used incorrectly, it leads to late entries and false confidence. Used correctly, it reinforces discipline, patience, and alignment with prevailing market conditions.
In 2026, the real edge is not spotting a golden cross on a chart. It is understanding what kind of golden cross it is, where it appears in the broader cycle, and what signals matter next.
Disclaimer
This article is for informational and educational purposes only and does not constitute investment advice. Investing involves risk, including the potential loss of principal. Readers should conduct their own research or consult a licensed financial advisor before making investment decisions.