
You may be wondering if Motley Fool’s price tag (which can reach up to $13,999/year) is really going to bring you a return on your investment. In this blog, we answer the question “Is Motley Fool worth it?”
The short answer: It depends on your investing style and portfolio size.
Motley Fool promises to help you identify transformative companies early and their self-reported data shows strong returns. But that’s only on every dollar you may have invested – not taking into account the subscription cost.
The platform’s strategy is to recommend you a small number of extraordinary winners that offset numerous losses and mediocre performers. Missing one top investment could leave your overall portfolio in the red.
You need substantial capital (they recommend $25,000 minimum, and up to $500,000 for premium tiers) and must invest in most of their recommendations to capture those few big winners.
Motley Fool works best if you are a patient, long-term growth investor with deep pockets who can weather volatility.
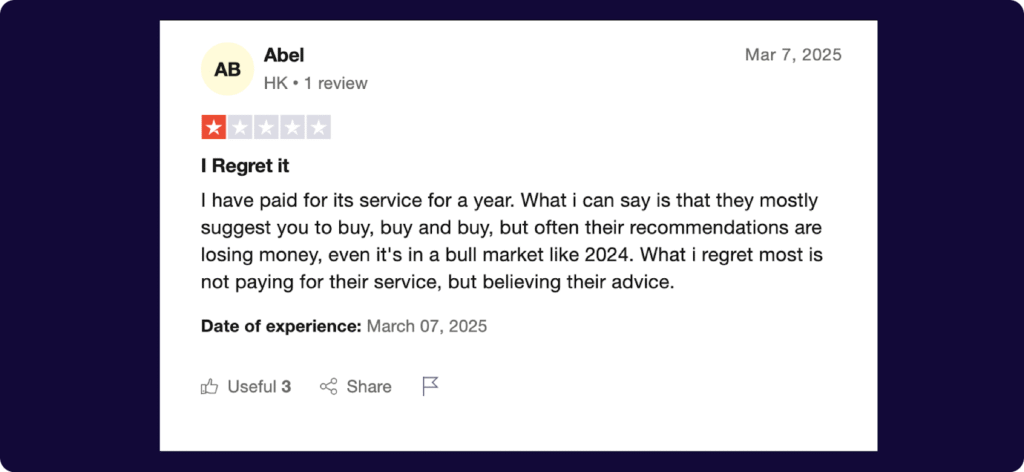
But before deciding if Motley Fool is right for you, pay attention to the broader market landscape. If the market is down or choppy (or nearing the end of a bull run and expected to decline) then Motley Fool picks may be less reliable. As they say “everyone is a genius in a bull market.”
In this comprehensive analysis, we’ll examine Motley Fool’s approach, limitations, and costs – and explore whether more affordable alternatives like Gainify can deliver advanced stock research capabilities without the hefty subscription fees or minimum investment requirements.
What Does a Motley Fool Subscription Give You?
Stock Advisor (Motley Fool’s cheapest plan) members get basic portfolio tracking tools, watchlists, historical performance data for all recommendations. You’ll also find educational content including research reports and Motley Fool Live programming as part of the subscription.
If you upgrade to a higher tier, you will gain access to:
- Fool IQ (historical financial data)
- GamePlan+ (financial planning hub)
- Access to Tom Gardner’s real-money portfolios
- The Motley Fool Quant 5Y (proprietary stock scoring system)
Community features
Beyond just stock analysis and reports, the Motley Fool does have a strong community aspect. If you join, you will have access to:
- Member profiles
- Facilitated conversations led by “Home Fools.”
- Discussion boards organized by topic and stock
How Does the Motley Fool Analyze Stocks?
You’ll find the deep insights from Motley Fool useful because they cover multiple analytical approaches. This level of research goes far beyond what you will find on many other platforms, making analytical depth one of the Motley Fool’s key strengths.
You will find that Motley Fool analyses cover 4 main areas:
- Quantitative analysis: A data-driven approach analyzing metrics such as revenue growth rates, profit margins, debt ratios, and more.
- Qualitative analysis: A non-numerical approach that considers things like management quality, corporate culture, business model viability, regulatory environment, and industry trends.
- Competitive advantages: Analyzing factors such as economies of scale, high switching costs, cost advantages, and intellectual property.
- Growth potential: This involves assessing market opportunity size, product innovation pipeline, geographic expansion possibilities, and industry growth trajectories that impact a company’s ability to increase revenue, earnings, and cash flow over time.
But if you rely only on Motley Fool’s picks – you won’t develop the research skills to uncover your own top picks. It’s best if you’re seeking actionable recommendations rather than tools for conducting your own comprehensive analysis. You’ll be limited by what the Motley Fool team and process can uncover.
As of January 2026, Motley Fool via their Moneyball database does enable you to conduct some of your own analysis and research. You can access metrics (ratings from 1-100) for a batch of 190+ to 3600+ companies (depending on subscription tier.)
Moneyball database is the Motley Fool’s proprietary AI-enabled method for reviewing, scoring, and analyzing companies.
To analyze 30,000+ stocks and discover quality companies to invest in on your own, you should use a platform like Gainify.
What About Motley Fool Conflicts of Interest?
To manage conflicts of interest, the Motley Fool maintains a comprehensive disclosure policy. This policy:
- Requires Motley Fool employees to hold stocks for at least 10 market days
- Prohibits Motley Fool employees from writing about stocks shortly before or after transactions
- Requires the Motley Fool maintain a list of all stocks held by employees and contractors
What Are the Limitations of Motley Fool?
The Motley Fool is best suited to growth investors who want to hold stocks for at least 5 years. If you trade more frequently, or are seeking dividend or value investing insights, you’re best using a platform like Gainify that enables you to implement any major investing strategy.
With Gainify you won’t be limited to any one approach. You can also replicate any investing strategy by forking top investor’s portfolios to your watchlist, including value investors like Warren Buffett and Seth Klarman, growth investors such as Chase Coleman and Cathie Wood, or machine learning/quant focused funds like those of James Simons.
Portfolio Size Limitations
If you have less than $25,000 available to invest then you will struggle to achieve the diversification required to really benefit from Motley Fool. As mentioned, while a little over half of trades recommended by Motley are profitable (based on historical analysis), many of these trades only just break even or make you little money.
Other trades may lose a lot. Most of the true gains from Motley Fool are tied up in a few select stock picks. To capture those few big winners you need to invest in most if not all of Motley’s recommendations, so you don’t miss the big winners.
You’d need between $25,000-$100,000 available to invest meaningfully in a majority of Motley’s stock pick recommendations.
If you’re a patient, long term growth investor with at least $25,000 to invest, you would be able to invest meaningfully in Motley Fool’s recommended minimum of 25 stock picks for a 5-year holding period.
What Complaints Do People Have About Motley Fool?
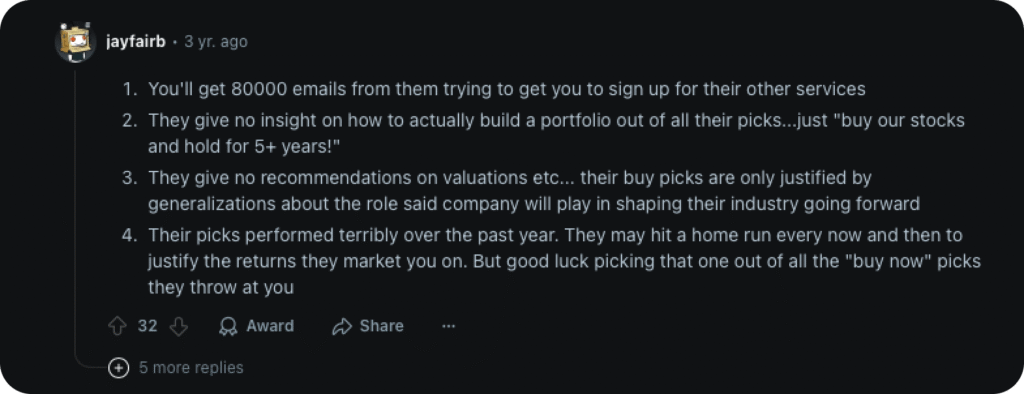
Some complain of aggressive marketing tactics and constant upselling. One Reddit user said “they constantly pester you to buy a higher level subscription is obnoxious. I hate it.”
Others say they feel overwhelmed by the constant recommendations and large volume of information.
If you’re a globally oriented investor, Motley Fool may be limiting due to its focus on US-based companies. So if you’re seeking under-appreciated opportunities in the EMEA, APAC, or other regions – the Motley Fool may not be the right platform for you.
The Motley Fool Effect
The “Motley Fool Effect” is where stock prices spike after recommendations. This makes it difficult for you to actually buy at recommended prices.
With thousands of readers and subscribers, you’ll be hard pressed to get in first to actually buy a stock when the price is right.
In comparison, with a stock research platform like Gainify – you are in control. You can uncover quality companies most investors miss, get in at the right price, and build a winning portfolio.
Bottom line: Gainify offers institutional-quality research at a fraction of the cost
Gainify delivers institutional-grade stock investment intelligence, real-time Wall Street data from S&P Global Intelligence, and AI-powered research capabilities – all at dramatically lower price points than Motley Fool.
Gainify is the best value for money stock research platform for retail investors available today.
You gain access to comparatively advanced stock analysis tools for less money – so you can research more stocks and get to keep more of your hard-earned returns.
Uncover dividend opportunities, dive deep into fundamentals to uncover true intrinsic value, and set up custom screeners to alert you when companies meet your specific investing criteria.
Gainify’s superior approach to investment research:
- Combines institutional-grade data with AI-powered analysis
- Offers the “world’s largest analyst estimate database for retail investors”
- Provides AI-generated earnings call summaries and insights
- Delivers proprietary metrics across five key dimensions
- Gives you an AI stock analyst assistant to answer your most important investment questions
AI Stock Analysis
Gainify’s breakthrough AI technology connects directly to live Wall Street data from S&P Global Intelligence, delivering you institutional-grade insights on demand.
Gainify AI enables you to:
- Deep-dive into individual stocks: “What’s the current outlook for Tesla’s fundamentals?”
- Conduct head-to-head comparisons: “How do Amazon and Walmart stack up on profitability and growth?
- Explore sector opportunities: “Which technology sub-sectors show the strongest revenue growth trends?”
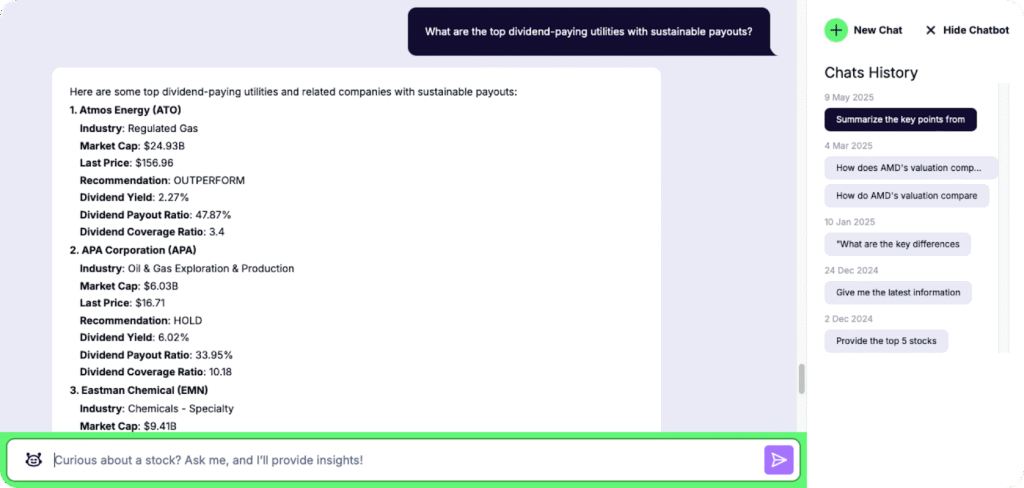
- Identify income investments: “What are the top dividend-paying utilities with sustainable payouts?”
Beyond instant analysis, Gainify’s AI-powered earnings call summaries transform lengthy quarterly calls into digestible insights. Rather than spending hours parsing through transcripts, you’ll get immediate access to management’s key messages, strategic shifts, updated guidance, and the financial metrics that matter most to your investment decisions.
Forward-Looking and Proprietary Metrics
Gainify gives you access to the world’s largest analyst estimate database for retail investors. You’ll find forward-looking estimates for key metrics like Revenue, EBITDA, and EPS.
Historical data shows how analyst estimates evolved over time, and is complimented by three-year forward projections for key metrics.
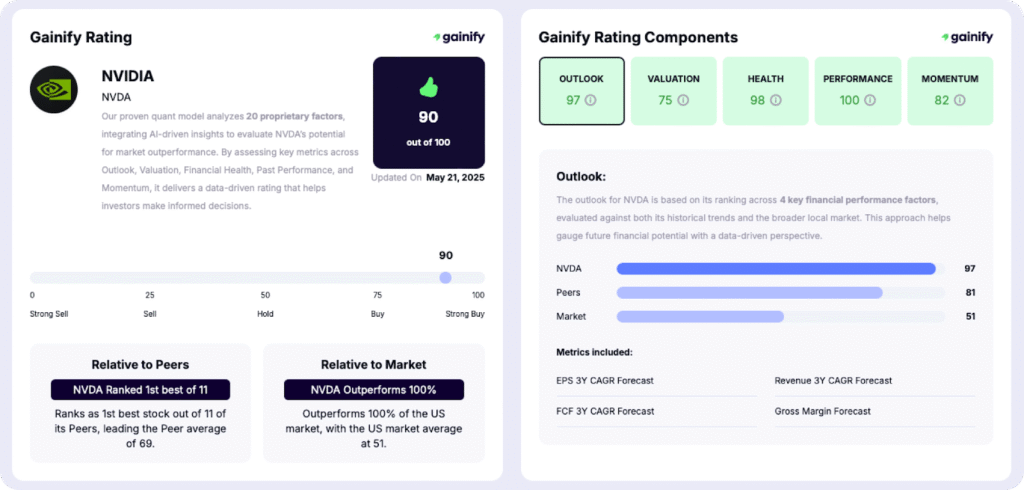
Not only that – but you will also gain access to proprietary metrics not found anywhere else. Gainify’s five-dimensional analysis framework covers:
Performance: Management’s Ability to Deliver Results
Performance gives you insights into how well management can deliver growth and create shareholder value. The metric examines historical growth and profitability trends over a 5 year timeline.
But there’s much more below the surface. Gainify’s proprietary performance metric is a composite of:
- Average return on capital: How effectively the company uses its resources to generate returns. This is more than just money in, money out. It indicates management’s skill in capital allocation and operational excellence.
- Revenue growth: Year-over-year growth trends in the company’s top line. Revenue growth represents the total money a company brings in from business activities before expenses.
- Earnings per share growth: Annual improvement in profitability metrics. Also called net income, profit, or bottom-line – earnings represents what is left after expenses, costs, taxes, interest etc. are deducted from revenue.
- Stock price growth: Consistent appreciation in share value. Unlike revenue and earnings which show what has already happened, stock price represents a mix of historical performance and future investor expectations.
This metric will help you uncover companies with proven track records of operational excellence.
Momentum: Market Strength and Price Movement Dynamics
Momentum gives you an idea of a stock’s current strength and expected future trajectory. This metric uses three different price-movement indicators to give you insights into short-term investor interest and potential upward or downward trends.
Key factors covered include:
- 90-day price change: Recent price performance over the past quarter. Reveals short term uptrends and downtrends.
- 52-week high proximity: Current price as a percentage of the stock’s 52-week high. Reveals how close a stock is to potential resistance or breakthrough.
- Relative strength index (RSI): A technical indicator. Reveals overbought or oversold conditions.
Gainify’s Momentum metric helps you evaluate the underlying forces driving a stock’s movement.
Valuation: Assessing Fair Value Against Market Benchmarks
Ganify’s valuation metric helps you understand whether a stock is undervalued, fairly priced, or overvalued in comparison with historical valuation and market benchmarks.
Valuation gives you a composite analysis of 5 key valuation metrics:
- Price-to-earnings (P/E) ratio: Compares the current share price to the company’s earnings per share. It shows you how much investors are willing to pay per dollar of earnings.
- Free cash flow yield (FCF Yield): Measures free cash flow per share relative to stock price. It shows you the cash return generated by the business compared to its market value. Higher yields typically mean better value.
- Price-to-revenue (P/Revenue) ratio: Evaluates the company’s market capitalization against total revenue. Useful for comparing companies within the same industry or those not yet profitable.
- Dividend yield:The annual dividend payment as a percentage of the stock price. It tells you the income return on investment from dividends alone.
- Upside potential: Assesses potential price appreciation based on analyst target prices and intrinsic value.
What makes Gainify’s approach particularly valuable is that you’ll also see how your stock of interest compares to its peers and the broader market.
Outlook: Projecting Future Growth Potential
Outlook metrics help you evaluate the growth trajectory and competitive positioning of a stock.
The Outlook dimension gives you unprecedented insights into future growth by ranking a company across 4 key financial performance factors:
- EPS 3-year CAGR: The projected compound annual growth rate of earnings per share over the next three years. This indicates analyst’s expectations for expanding profitability.
- Revenue 3-year CAGR: The anticipated compound annual growth rate of a company’s top-line revenue over the next three years. This reveals expected business expansion.
- Free cash flow (FCF) 3-year CAGR: Evaluates projected growth in free cash flow. This provides you insights into a company’s ability to generate cash available for shareholder returns or reinvestment.
- Gross margin forecast: Predicts the company’s future gross profit margin. This indicates whether the business is expected to become more or less efficient at generating profit from revenue.
Health: Evaluating Financial Stability and Risk
Gainify’s Health dimension gives you insights into a company’s ability to weather economic downturns and meet its long-term obligations.
You’ll gain insights into 4 key balance sheet stability metrics:
- Total debt/equity: The proportion of a company’s financing that comes from debt versus shareholders’ equity. This indicates the level of financial leverage (and potential risk.)
- Total debt/EBITDA: Evaluates debt burden relative to earnings before interest, taxes, depreciation, and amortization. This shows you how many years of operating profits would be needed to pay off all debt.
- Interest coverage: Calculates how many times a company’s operating income can cover its interest expenses. This reveals the company’s ability to meet debt obligations without experiencing financial strain.
- Assets to liabilities: Compares total assets to total liabilities. This provides a 1) broad measure of financial solvency and 2) indicates the cushion available to protect creditors in worst-case scenarios.
Keep an eye on Gainify’s Health metric for risk management, especially during periods of economic uncertainty.
Important note about financial metrics
Gainify’s proprietary metrics provide powerful insights. However, while each dimension offers a valuable perspective, no single metric should be used in isolation.
Valuation indicates potential value, but must be weighed against growth aspects, historical execution, financial stability, and current market sentiment.
These metrics serve as analytical tools for understanding relative positioning, not as definitive investment recommendations.
Earnings Calendar
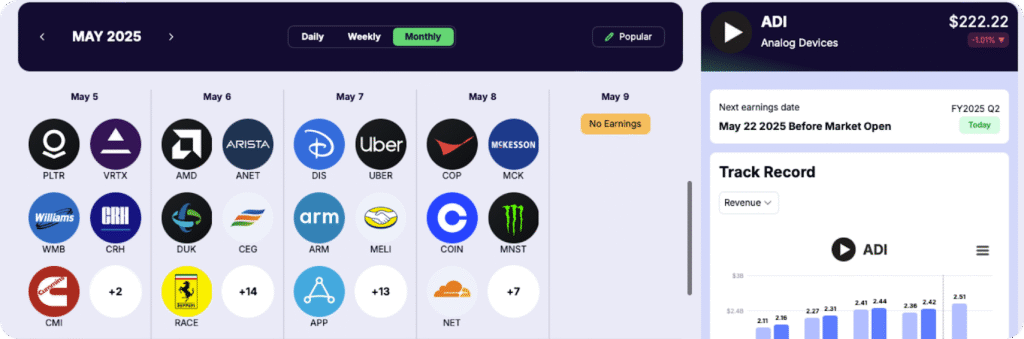
Many investment ideas are hidden in long earnings call transcripts. Gainify AI makes it easy to uncover the most impactful things mentioned in earnings calls, so you can make more informed calls.
Gainify’s earnings calendar lays it all out clearly for you. Never miss an important earnings announcement again – and quickly analyze each earnings call using Gainify AI.
There are two ways to use Gainify AI for earnings call analysis:
- On the individual stock page: Gainify AI automatically finds the top insights from an earnings call that could have the most impact on a stock’s trajectory.
- With the AI stock analysis assistant: Ask Gainify AI to summarize any earnings call for you. Ask follow up questions to dive deeper into specific aspects. And even compare with competitors in the same industry.
Customizable Screeners
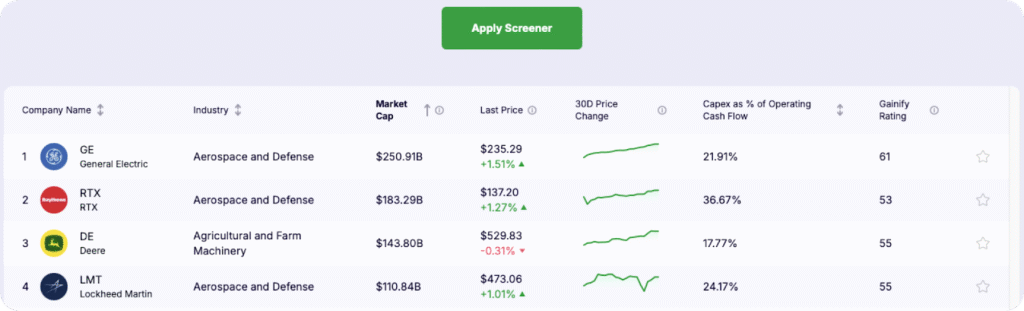
Customizable screeners with 1000+ metrics enable you to find opportunities matching your specific criteria.
Find investment opportunities across 39+ global exchanges and 150+ industries using both geographic filters (33 countries including US, China, UK) and sector-specific criteria.
Screen by market metrics (analyst recommendations, RSI, beta), forward-looking projections (Revenue, EBITDA, EPS growth rates), balance sheet strength, cash flow metrics, dividend characteristics, and valuation multiples.
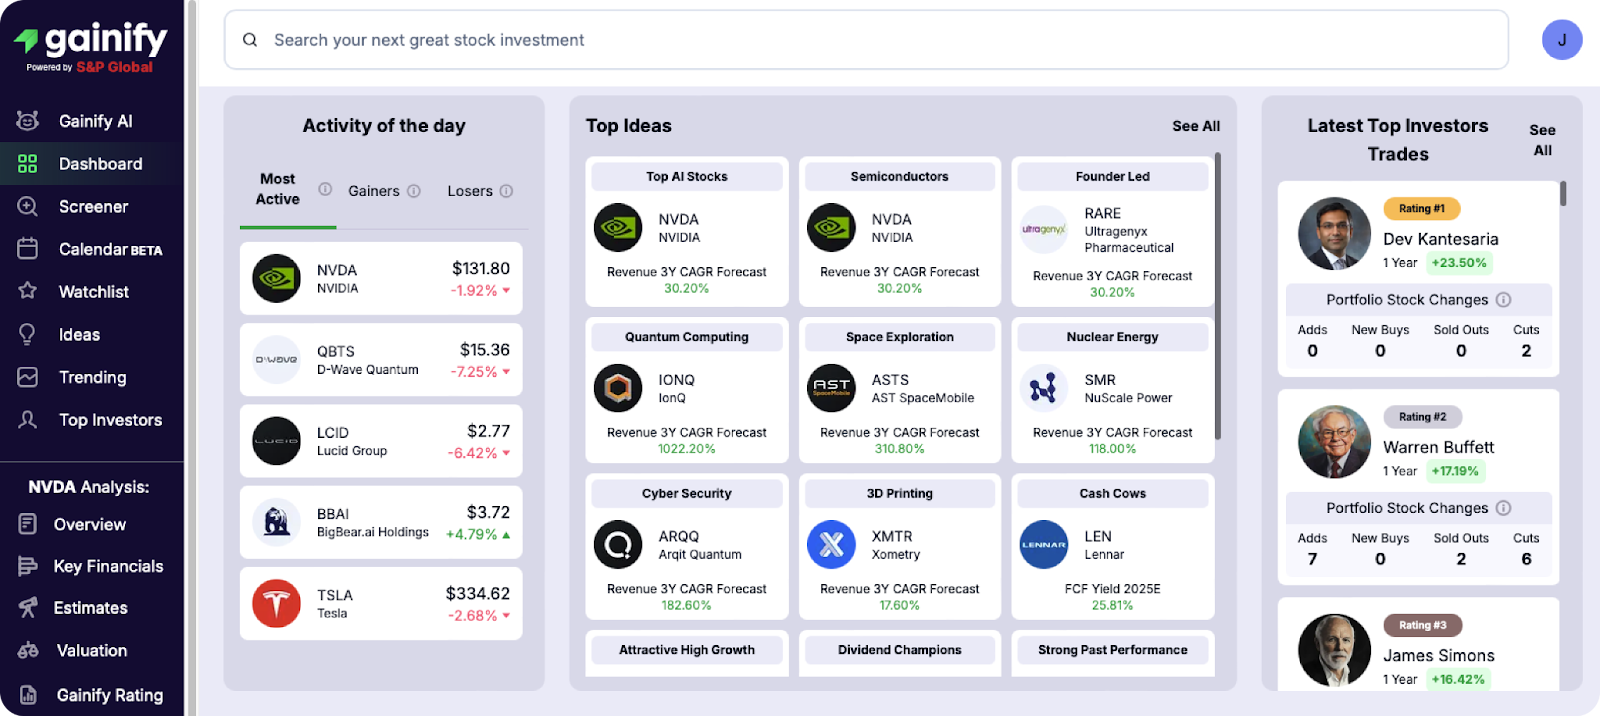
Top Investor Tracking
There’s no need to pay thousands of dollars per year if you want to know which stocks the experts recommend. You can uncover top investor’s picks simply by looking at their portfolios and trading activity.
Gainify’s top investor tracking gives you access to:
- Real-time monitoring of top investors like Warren Buffett and Chase Coleman
- Alerts when top investors buy or sell stocks
- One-click to copy your favorite investor portfolios to your own Gainify watchlist
- Compare top investors head-to-head to see whose investment strategy performs best
You’ll also be able to uncover the stocks that Congress insiders are buying and selling the most.
Early insights into what market legends are buying & selling after extensive research is just as valuable as a Motley Fool stock pick.
Conclusion: Motley Fool’s value depends on your investor profile
If you have adequate capital, a long-term growth orientation, and the temperament to withstand market volatility – Motley Fool may be worth it for you.
However, with a minimum recommended portfolio size of $25,000 (this is Motley Fool’s recommendation, not ours) – it’s not suitable for many investors. Especially if you don’t want to have all your money tied up in Motley Fool picks, and want to have more portfolio diversity or pursue different investing strategies.
Motley Fool’s ideal investor is someone with at leask $25k to invest, and who is willing to hold positions for 5+ years – even through market volatility.
That being said – its top tier plan comes in at a little less than $15k/year recommends a portfolio size of a whopping $500,000. That’s a lot of money to entrust with Motley Fool picks.
For most retail investors in 2026, platforms like Gainify offer a more cost-effective alternative with comparable or superior capabilities. With a free tier that provides access to core features and affordable premium plans, Gainify’s combination of AI-powered analysis, extensive Wall Street data from S&P Global Intelligence, and proprietary metrics covering 20 unique aspects of a stock, makes it an attractive alternative to Motley Fool’s extremely expensive subscription tiers.
If you choose a platform like Gainify you won’t sacrifice research depth compared to Motley Fool, and you will be able to analyze stocks on your terms. No waiting for a Motley Fool pick to come in. Just log in to Gainify and research companies with unlimited stock reports and 500 AI queries on Gainify’s affordable Gainer Pro plan at just $26.99/month.
Frequently Asked Questions
How much does Motley Fool cost?
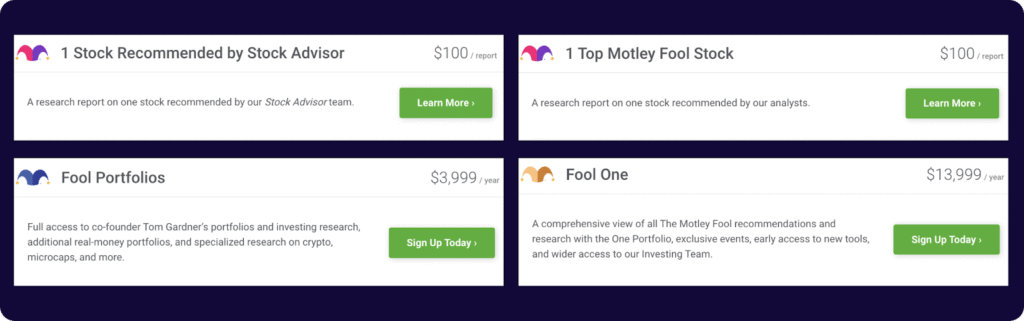
Motley Fool’s subscription prices vary widely, from their basic Stock Advisor service to premium offerings that can cost up to $13,999 per year for their highest tier plans. This pricing structure means you need significant investment returns just to offset the subscription costs, especially for higher-tier services.
What is the Motley Fool’s average performance?
According to Motley Fool’s self-reported data, their stock picks have shown strong returns since 2002. However, their strategy relies on a small number of extraordinary winners that offset numerous losses or breakeven positions. This means you need to invest in most of their recommendations to achieve their advertised performance, as missing just one top performer could significantly impact your overall returns.
What minimum portfolio size do I need for Motley Fool?
Motley Fool recommends a minimum portfolio size of $25,000 to properly diversify across their stock picks. For their premium services, they suggest a minimum portfolio of $500,000. This is because you need to invest in most of their recommendations to capture the few big winners that drive their overall performance statistics.
Does Motley Fool work in all market conditions?
No. Subscribers who joined during the 2020-2021 bull market frequently report underperformance as growth stocks declined significantly in the years that followed. Motley Fool’s performance tends to be stronger during bull markets and may struggle during market downturns or choppy periods, especially since they focus primarily on growth stocks.
What is included in a Motley Fool subscription?
The basic Stock Advisor membership includes portfolio tracking tools, watchlists, historical performance data for recommendations, educational content, research reports, and access to Motley Fool Live programming. Higher tiers add features like Fool IQ (historical financial data), GamePlan+ (financial planning hub), access to Tom Gardner’s real-money portfolios, and the Motley Fool Quant 5Y proprietary stock scoring system.
What investing style does Motley Fool focus on?
Motley Fool primarily focuses on growth investing strategies. If you’re more interested in dividend investing, value investing, or other approaches, you might find their recommendations less aligned with your goals. Platforms like Gainify offer more flexibility to implement various investment strategies including value, growth, and dividend approaches.
What is the “Motley Fool Effect”?
The “Motley Fool Effect” refers to the phenomenon where stock prices spike immediately after the Motley Fool recommends them. This price action happens because thousands of subscribers attempt to buy the recommendation simultaneously. As a result, many subscribers struggle to purchase shares at the recommended prices, potentially reducing their actual returns compared to Motley Fool’s reported performance.
How does Motley Fool’s stock analysis approach work?
Motley Fool analyzes stocks using four main approaches: quantitative analysis (examining metrics like revenue growth rates and profit margins), qualitative analysis (evaluating factors like management quality and business models), competitive advantages assessment, and growth potential evaluation (market opportunity size, innovation pipeline, etc.).
What are the best alternatives to Motley Fool?
Gainify stands out as a cost-effective alternative that offers institutional-grade data from S&P Global Intelligence combined with AI-powered analysis capabilities. Unlike Motley Fool’s approach of providing specific stock picks, Gainify empowers you to conduct your own research with proprietary metrics, analyst estimates, top investor tracking, and AI tools—all at a fraction of Motley Fool’s cost.
How does the Motley Fool handle potential conflicts of interest?
Motley Fool maintains a disclosure policy that requires employees to hold stocks for at least 10 market days, prohibits writing about stocks shortly before or after transactions, and maintains a list of all stocks held by employees and contractors. These measures aim to reduce potential conflicts of interest in their recommendations.