
With Amazon vs. Walmart as a Real-World Example
Comparing stocks is one of the most important skills an investor can develop, but it’s also one of the most misunderstood.
Most people compare stocks using a single number (P/E, revenue growth, or margin) and stop there. That approach rarely works.
A proper stock comparison must look across growth, profitability, cash generation, valuation, and financial strength, because companies compete differently depending on their business model and maturity.
Below is a complete framework explaining why each metric matters and illustrations using Amazon (NASDAQ:AMZN) vs Walmart (NYSE:WMT) as living examples.
How to Compare Two Stocks: A 6-Dimension Framework
Before we dive into Amazon vs. Walmart, it’s important to recognize that no single metric can tell you whether a stock is “better.”
Professional investors evaluate companies across multiple dimensions — each answering a different question about the business.
For this guide, we use a 6-dimension comparison framework:
- Revenue Growth – Is the business expanding?
- Margins (Gross & Net Income) – How efficient is the business model?
- Cash Flow (Operating & Free Cash Flow) – How much real cash does the company generate?
- Solvency (Debt Ratios) – How financially safe and flexible is the company?
- Valuation (P/E, PEG) – How expensive is the stock relative to its performance?
- Management Quality & Competitive Moat Strength – the “soft” but essential dimension that often separates the good companies from the generational compounders
This multi-angle approach allows investors (beginners or experts) to compare any two stocks in a structured, objective way.
Now let’s go step-by-step through the first dimension.
1. Revenue Growth — The Foundation of Long-Term Value
Why This Metric Matters
Revenue growth is one of the clearest indicators of a company’s underlying strength. It tells you, in the simplest possible way, whether demand for the business is rising, stable, or slipping.
When revenues grow, it usually means the company is attracting more customers, expanding into new markets, or successfully increasing wallet share with existing users.
Companies with strong, sustained revenue growth often gain market share, build better economies of scale, and create more flexibility to invest in new products or higher-margin businesses. Even slower-growing firms can deliver solid returns, but high-growth companies tend to compound value more effectively because their opportunity set keeps expanding.
What Revenue Growth Really Signals
When you study revenue growth, you’re essentially answering three investor-critical questions:
- Is the company taking or losing market share?
Outgrowing the industry usually means competitive strength; lagging signals that rivals may be winning. - Is business momentum improving or fading?
Higher or lower growth rates often foreshadow the direction of future profits. - Can the business unlock operating leverage as it scales?
When revenue grows faster than costs, margins expand — the engine of long-term compounding.
Because of this, revenue growth is almost always the first metric investors compare when evaluating two companies side-by-side.
Amazon vs. Walmart — What the Revenue Data Shows
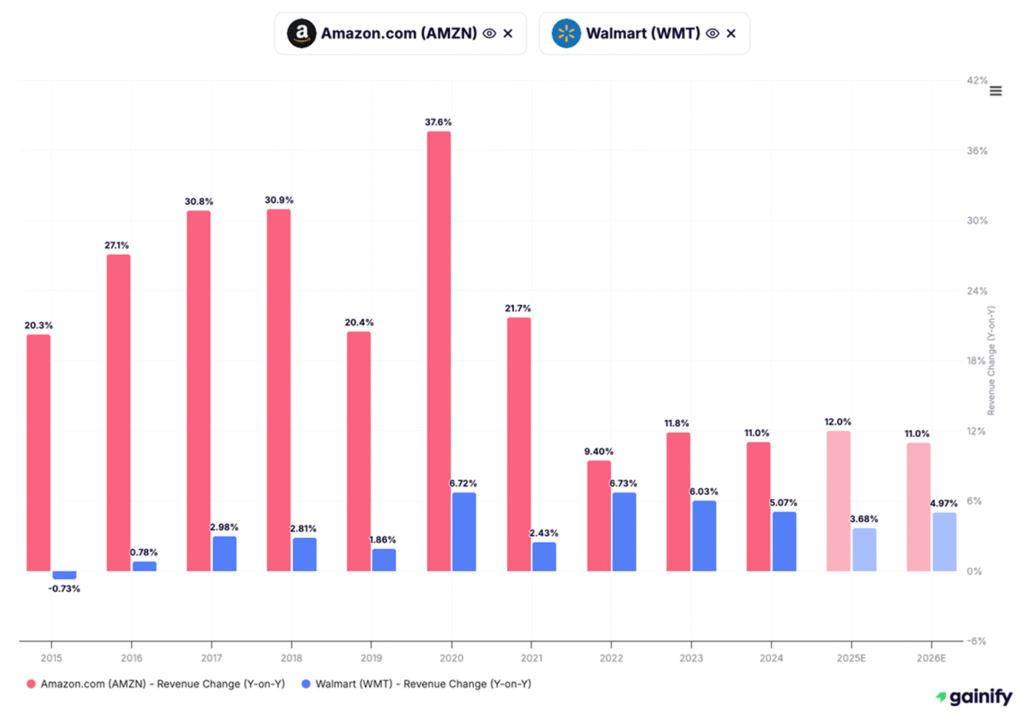
The revenue-growth chart from 2015–2026E highlights a clear divergence in business models and growth trajectories:
Amazon (AMZN)
- Historically grows 2–4x faster than Walmart
- 2026E revenue growth: ~11%
- Growth supported by e-commerce, AWS, advertising, logistics, and international expansion
Walmart (WMT)
- Consistent but modest growth
- 2026E revenue growth: ~5%
- A model built around stability, scale efficiency, and predictable customer demand — not rapid expansion
Takeaway for Investors
Amazon is the stronger long-term growth compounder because it has multiple high-growth engines (AWS, ads, marketplace services, and logistics) all pushing revenue higher at the same time.
Walmart remains an exceptionally steady, resilient operator, but its slower revenue growth profile points to a more modest long-run appreciation trajectory.
- Choose Amazon if you want higher growth and more upside.
- Choose Walmart if you want stability and predictability.
2. Margin Development — The Core Measure of Operational Quality
Why This Metric Matters
If revenue growth shows how quickly a company is expanding, margin development shows how well that growth is being converted into real profitability. Margins reveal the underlying discipline of a business: pricing power, competitive strength, operating efficiency, and the quality of the company’s revenue mix.
Two margin measures matter most to long-term investors:
Gross Profit Margin
Shows product-level profitability. High gross margins indicate differentiated offerings, strong brand power, or an advantaged cost structure.
Net Income Margin
Captures the true bottom-line efficiency of the entire business. Companies with expanding net margins demonstrate improving operations, rising leverage on fixed costs, or a shift toward higher-value revenue streams.
Companies with expanding margins generate more cash, compound faster, and weather downturns better. Those with shrinking margins often struggle with rising costs or competitive pressure.
What Margin Trends Really Signal
When analyzing margin development, you are answering three essential questions:
- Does the business have pricing power?
Companies that maintain or expand margins — even when costs rise — typically have strong moats or highly valuable products. - Is the company benefiting from scale?
When revenues grow faster than expenses, net income margins expand. This is the engine of long-term earnings compounding. - Is the overall business mix improving?
Companies shifting toward higher-margin segments often see accelerating profitability even if revenue growth is modest.
Margin development helps investors determine whether growth is translating into actual shareholder value.
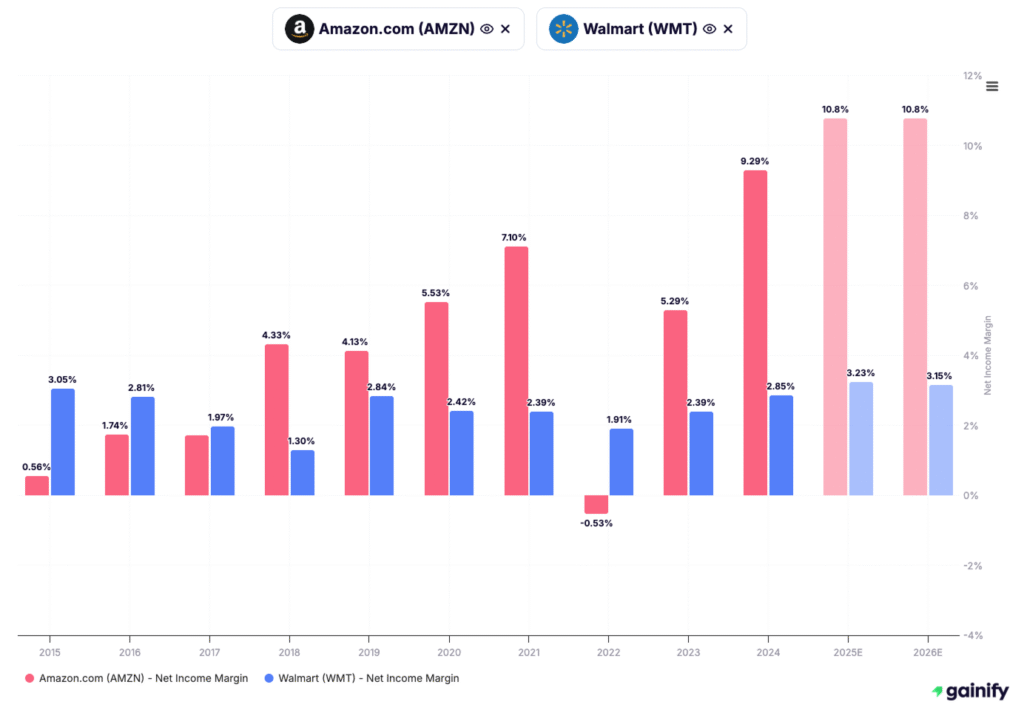
Amazon vs. Walmart — What the Margin Data Shows
The charts for gross profit margin and net income margin highlight two fundamentally different business models:
Amazon (AMZN)
- Gross margins have expanded meaningfully as high-margin segments (AWS, ads) grow faster than retail
- Net margins improved consistently from the early 2020s as the cost base scaled
- Profitability builds rapidly because Amazon’s most lucrative businesses now contribute a larger portion of total revenue
Amazon’s margin expansion reflects a shift from pure retail toward technology, services, and advertising — all far more profitable segments.
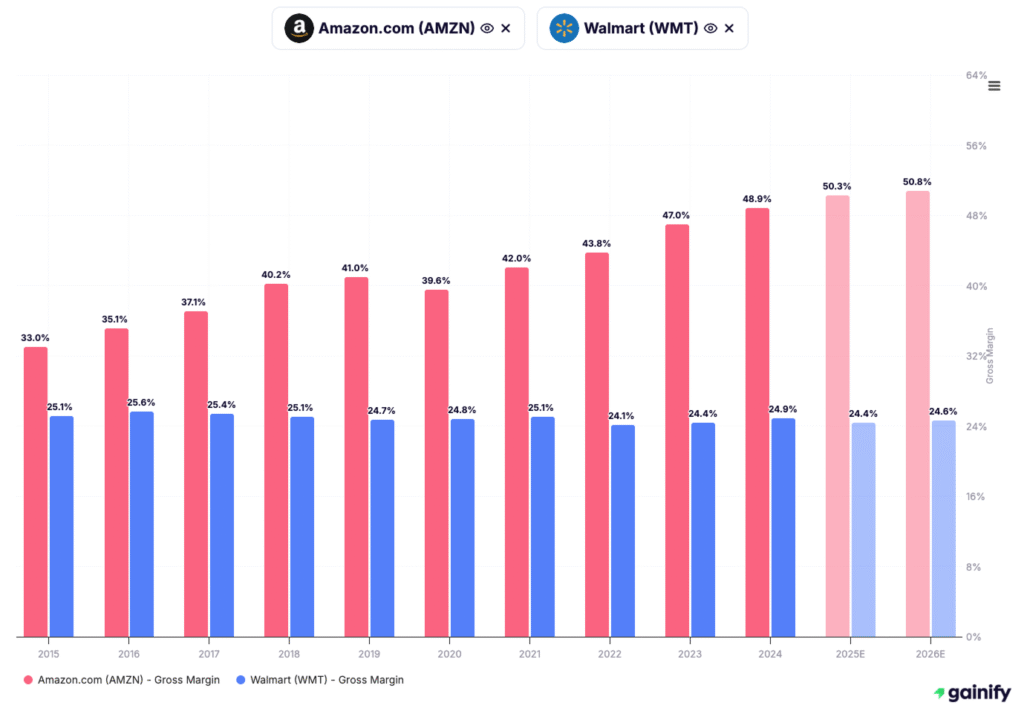
Walmart (WMT)
- Gross margins remain steady in a narrow band due to the low-markup retail model
- Net income margins stay thin, reflecting Walmart’s scale-and-efficiency strategy rather than pricing power
- Product mix and competitive dynamics limit long-term margin expansion
Walmart’s margin structure prioritizes stability and affordability over high profitability.
Takeaway for Investors
Amazon’s margin trajectory is structurally improving, driven by AWS, advertising, subscription services, and logistics efficiencies. These engines allow Amazon to grow earnings materially faster than revenue — a defining feature of long-term compounders.
Walmart’s margins reflect its strategic role as a high-volume, low-price operator. The margins are stable, dependable, and defensive, but not positioned for multi-year expansion.
If you want a business with rising profitability and long-term earnings leverage, Amazon is the stronger choice.
If you want consistency and defensive performance, Walmart offers predictable, steady margins.
3. Free Cash Flow Generation — The True Measure of Financial Strength
Why This Metric Matters
Free cash flow (FCF) is one of the most important indicators of a company’s financial quality. Unlike earnings, which can be influenced by accounting decisions, FCF shows how much real cash a business generates after covering all operating expenses and capital investments.
A company that consistently produces strong FCF has greater flexibility to:
- invest in growth,
- pay down debt,
- repurchase shares, or
- distribute dividends.
High FCF also provides resilience during economic slowdowns and helps support long-term compounding. Companies with weak or inconsistent FCF may rely on debt or equity issuance to fund growth, which creates additional risk for investors.
What Free Cash Flow Really Tells Investors
When evaluating FCF, you’re answering three fundamental questions:
- Is the business converting profits into real cash?
Strong FCF indicates efficient operations and disciplined reinvestment. - Can the company self-fund its long-term growth?
Companies with high FCF don’t need to rely on external financing to scale. - Is the company’s capital allocation strategy effective?
FCF supports buybacks, acquisitions, and R&D — the tools of long-term value creation.
In short, FCF reveals whether the business model produces durable, repeatable cash generation.
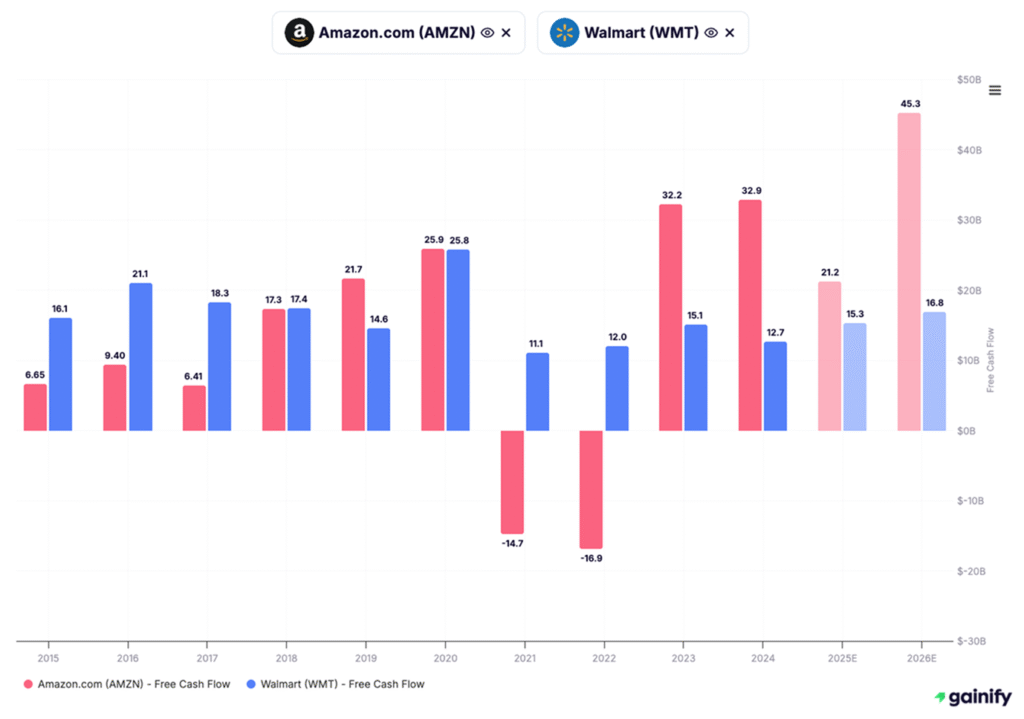
Amazon vs. Walmart — What the Cash Flow Data Shows
The FCF chart highlights one of the most important differences between the two companies:
Amazon (AMZN)
- FCF has expanded sharply since 2023 as capital intensity normalized
- AWS and advertising are highly cash-generative and now drive the majority of total FCF
- Amazon’s FCF is projected to continue accelerating, providing significant flexibility for reinvestment and buybacks
Amazon’s FCF recovery and growth are tied directly to its shift toward higher-margin, less capital-intensive segments.
Walmart (WMT)
- FCF is steady but relatively modest due to large recurring investments in stores, supply chain, and labor
- Retail margins limit cash generation compared to high-margin tech platforms
- FCF is stable and defensive, but not positioned for significant long-term acceleration
Walmart’s FCF profile reflects its model: reliable, resilient, but structurally limited in upside.
Takeaway for Investors
Amazon’s free cash flow profile has transformed over the past several years. With AWS and advertising accounting for a growing share of total profits, Amazon’s FCF is rising rapidly — giving it substantial flexibility to reinvest and compound earnings.
Walmart’s FCF remains consistent and dependable but constrained by the inherent economics of brick-and-mortar retail.
If you want accelerating cash generation and long-term reinvestment optionality, Amazon stands out.
If you want dependable, stable cash flows, Walmart delivers consistency with lower volatility.
4. Solvency & Balance-Sheet Strength — The Foundation of Financial Stability
Why This Metric Matters
Solvency measures a company’s ability to meet its long-term obligations and maintain financial flexibility through economic cycles. While growth, margins, and cash flow drive performance, solvency determines survivability and stability — especially during periods of rising rates, slowing demand, or unexpected shocks.
Strong solvency allows a company to:
- refinance debt at favorable rates,
- invest aggressively during downturns,
- avoid forced asset sales, and
- preserve shareholder returns (buybacks, dividends).
Weak solvency limits strategy. It forces management to cut spending, reduce investment, and prioritize debt service over innovation.
For long-term investors, solvency is the balance-sheet anchor that determines how durable a business truly is.
What Solvency Really Tells Investors
When assessing solvency, you are answering three critical questions:
- Does the company have enough cash flow to service and repay its debt?
High interest-coverage ratios signal a safe balance sheet; low ratios suggest vulnerability during downturns. - Is the company over-leveraged relative to its earnings power?
Metrics like Net Debt / EBITDA help investors understand whether debt levels are reasonable. - Does the company maintain flexibility to invest through the cycle?
Companies with strong solvency can take advantage of opportunities — rather than react defensively to risk.
Solvency determines whether a company can continue pursuing its strategy without financial strain.
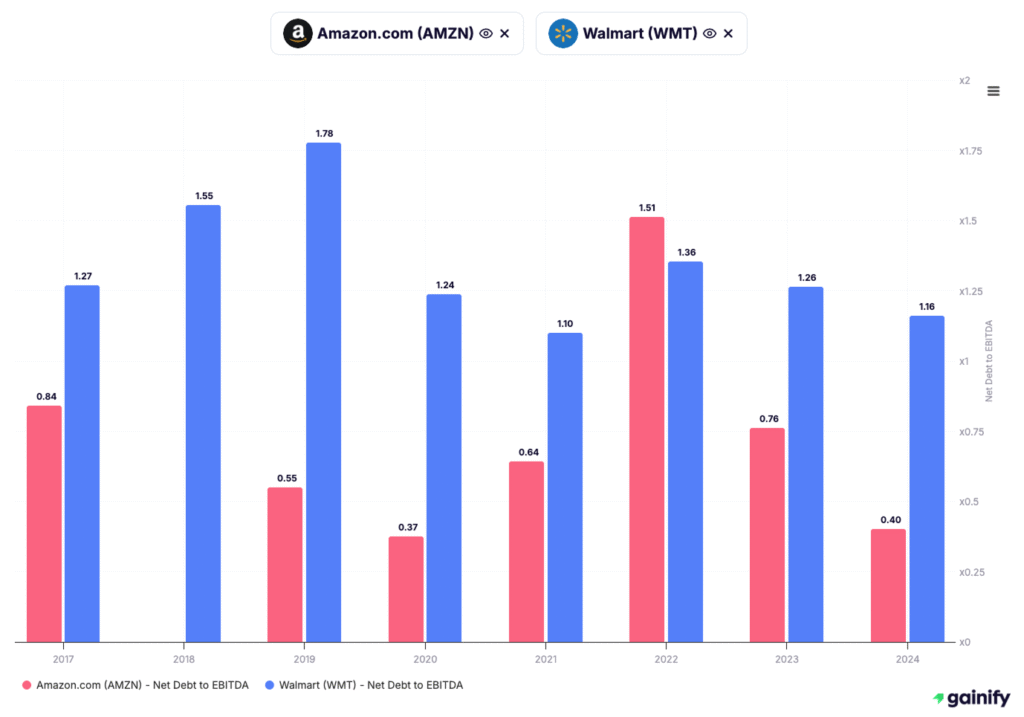
Amazon vs. Walmart — What the Solvency Data Shows
The solvency metrics reveal two distinct capital structures:
Amazon (AMZN)
- Low net leverage, supported by strong and improving cash generation
- High interest-coverage ratios due to the cash-rich AWS and advertising segments
- Significant liquidity reserves, giving Amazon the ability to invest through downturns
- Balance sheet increasingly resembles a large-cap tech firm rather than a retailer
Amazon’s solvency profile is strong and improving, supported by high-margin, low-capital-intensity businesses.
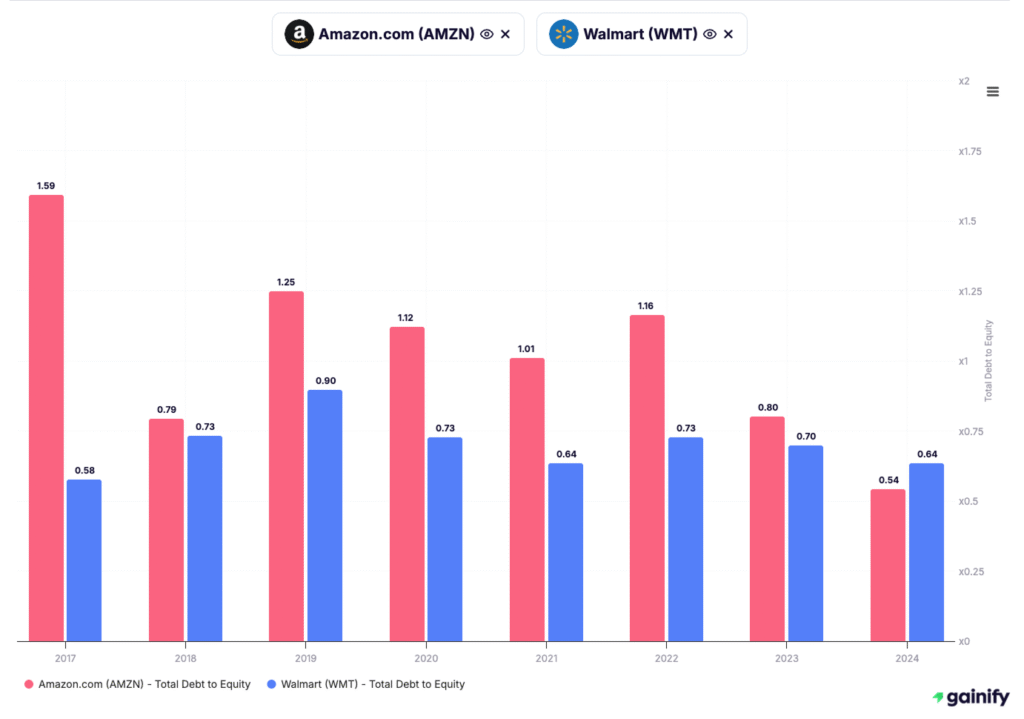
Walmart (WMT)
- Higher absolute debt due to store networks, logistics assets, and global operations
- Interest coverage solid but lower than Amazon due to thinner margins
- Reliable cash flow supports debt service, but capital intensity limits rapid deleveraging
- Solvency stable and dependable, but without major structural improvement expected
Walmart’s solvency is built on consistency and scale, not expanding cash flow or margin leverage.
Takeaway for Investors
Amazon’s solvency profile is strengthening year after year. Its earnings mix is shifting toward segments that generate abundant cash and require little capital, allowing Amazon to maintain low leverage and high financial flexibility.
Walmart’s solvency is steady and predictable, but bounded by the capital demands of global retail. It is safe, but does not have the same upward trajectory in balance-sheet strength.
If you want improving solvency and increasing financial flexibility, Amazon is the stronger choice.
If you want predictable, stable balance-sheet performance, Walmart remains a solid defensive profile.
5. Valuation — P/E and PEG Ratios
Why This Metric Matters
Valuation tells you whether a stock is priced attractively relative to the earnings and growth it can produce. It doesn’t matter how strong a business is — if you pay too much for it, long-term returns suffer.
That’s why investors rely heavily on two core valuation measures:
Forward Price-to-Earnings (P/E)
Shows how much investors are paying for next year’s earnings.
A lower P/E suggests a cheaper stock; a higher P/E implies either strong optimism or stretched expectations.
PEG Ratio (Price/Earnings-to-Growth)
Takes valuation a step further by asking a deeper question: Is the growth worth the price?
PEG adjusts P/E for expected earnings growth. A PEG below 1.5 generally signals reasonable value; anything above 2.5 suggests the stock may be expensive relative to its growth rate.
Together, P/E and PEG show whether a company offers a good balance between price, growth, and earnings power.
What Valuation Really Signals
When you evaluate valuation metrics, you’re answering three important investor questions:
Is the stock priced fairly for its earnings potential?
If a company has a lower P/E than peers, it may offer more upside if earnings rise.
Is the market overpaying or underpaying for expected growth?
High PEG ratios often reflect unrealistic optimism.
Does one business offer a better long-term risk/reward profile?
Companies with lower PEG and healthy growth typically compound value more efficiently.
This makes valuation a critical dimension when comparing stocks side-by-side, and the best stock analysis tools can help you track these ratios efficiently.
Amazon vs. Walmart — What the Valuation Data Shows
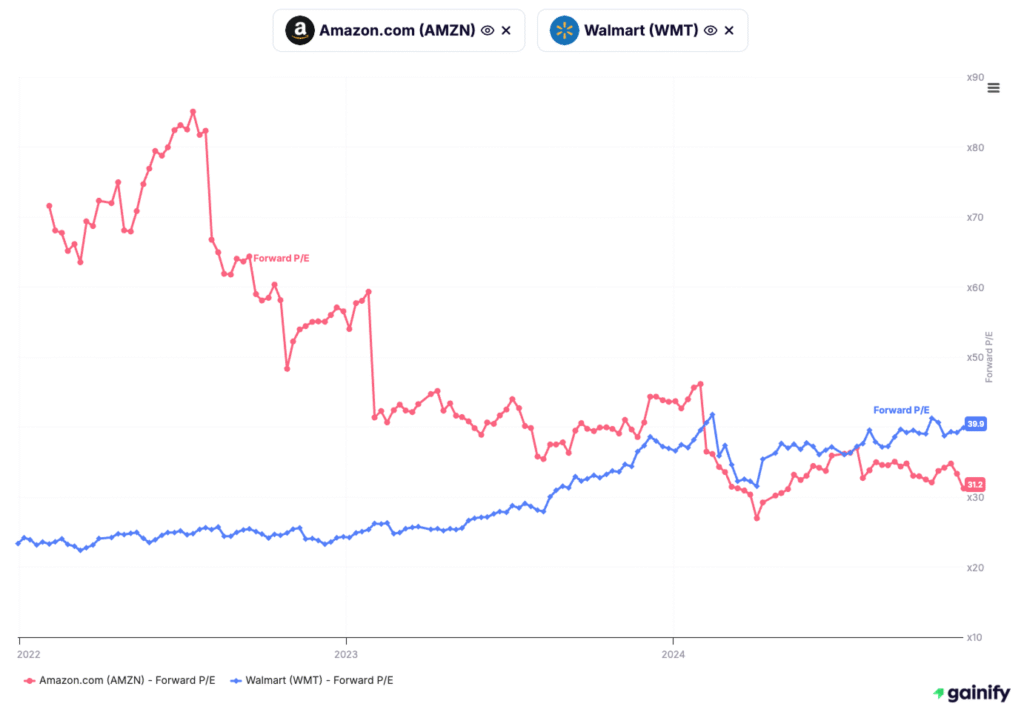
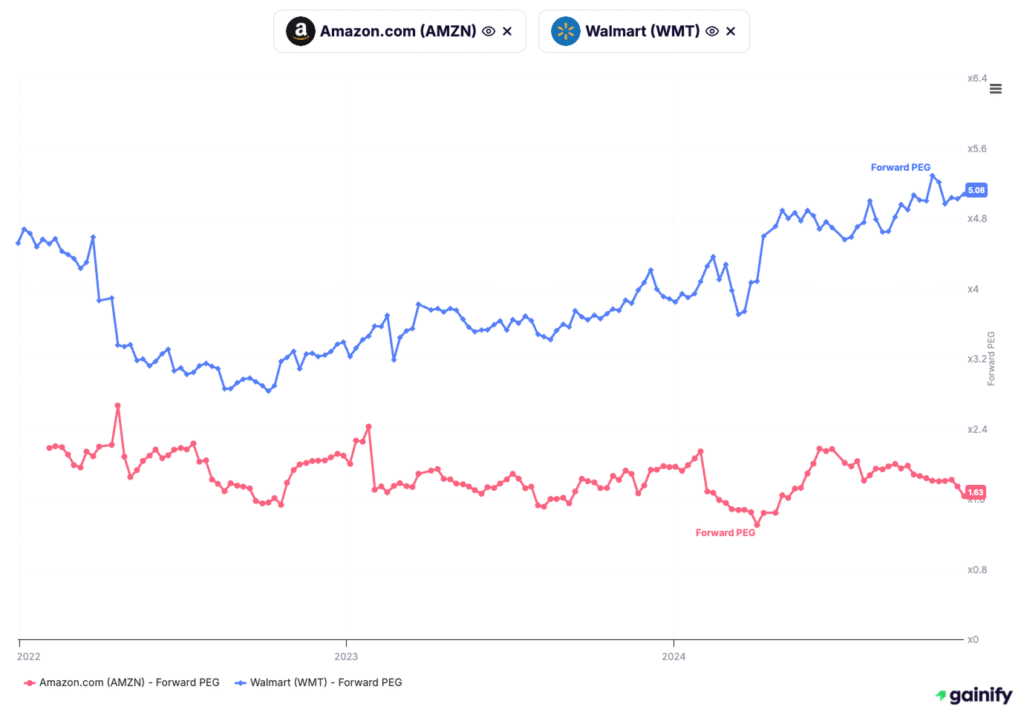
Using the Forward P/E and Forward PEG charts (2022–2024), the differences between Amazon and Walmart become clear:
Amazon (AMZN)
Forward P/E
- Has fallen significantly over two years
- 2024 level: ~31x, down from ~60s in early 2022
- Reflects improving profitability, stronger earnings visibility, and reduced volatility
Forward PEG
- Remarkably low relative to its growth
- 2024 PEG: ~1.6x
- Indicates Amazon’s valuation is aligned with — or even cheap for — its growth prospects
Interpretation: Amazon is now priced more attractively than in past years, with valuation finally reflecting the strength of AWS, advertising, and operating efficiency improvements.
Walmart (WMT)
Forward P/E
- More stable but trending upward
- 2024 P/E: ~39.9x
- Investors are paying a premium for stability and consistency
Forward PEG
- Shows a sharp divergence from Amazon
- 2024 PEG: ~5.1x
- Suggests Walmart is priced high relative to its expected growth
Interpretation: Walmart trades like a defensive safe haven — but investors are paying a substantial premium for modest earnings growth.
Takeaway for Investors
Amazon’s valuation is much more attractive when matched with its growth profile.
Lower P/E, far lower PEG, and higher earnings growth give Amazon a significantly better risk/reward setup.
Walmart offers stability, but at a premium.
Investors are paying roughly 3x more per unit of growth compared with Amazon — a meaningful difference for long-term compounding.
If you want:
- Growth at reasonable valuation → Amazon leads
- Stability at any cost → Walmart fits that role
6. Management & Competitive Moat — The Intangibles That Create Durable Winners
Why This Metric Matters
Not every advantage shows up directly in financial statements. Some of the most powerful drivers of long-term returns come from management decisions, strategic discipline, culture, and the strength of a company’s competitive moat.
This dimension answers a deeper question: Why does this company win and can it keep winning?
High-quality management teams allocate capital effectively, invest through downturns, build durable ecosystems, and reinforce competitive advantages that protect margins and market share.
Meanwhile, a strong competitive moat makes it hard for rivals to copy the business — giving the company pricing power, resilience, and financial consistency over time.
Moats can come from:
- Network effects
- Brand strength
- Switching costs
- Cost advantages / scale
- Technology leadership
- Regulatory positioning
Companies with deep moats and disciplined management tend to outperform over decades, not just cycles.
What This Really Signals for Investors
Evaluating management & moats helps investors answer three critical questions that financial metrics alone can’t capture:
Does the company have a structural advantage competitors can’t easily replicate?
If yes, margins and returns on capital tend to stay strong even when markets get tougher.
Does management consistently make value-creating decisions?
Capital allocation is one of the most powerful — and overlooked — forces behind long-term wealth creation.
How resilient is the company during economic stress?
Businesses with strong moats typically emerge stronger from downturns, not weaker.
Because of this, moat strength and management quality act as the “glue” that holds the other five dimensions together.
Amazon vs. Walmart — What the Intangibles Show
Amazon (AMZN)
Amazon’s moat is built around scale, technology, logistics, and ecosystem lock-in:
- AWS gives Amazon unmatched cloud leadership and massive cash-flow leverage
- Customer switching costs are high across Prime, marketplace, logistics, and storage
- Investments in automation, AI, and fulfillment continually deepen its cost advantage
- Management is known for long-term, cash-flow focused decisions (vs. short-term profit optics)
Amazon’s leadership team embraces bold innovation, even at the expense of short-term profitability, which has paid off repeatedly (AWS, Ads, Prime, Logistics).
Overall moat strength: extremely high.
Walmart (WMT)
Walmart’s moat is built around scale, cost, and physical distribution:
- The largest physical retail network in the US
- Incredible bargaining power with suppliers
- Best-in-class inventory and logistics management
- Strong brand recognition and trust
Management emphasizes operational discipline, efficiency, and stable execution less innovation-driven, more consistency-driven.
While Walmart’s moat is durable, it is more tied to physical scale and cost leadership, with fewer high-growth technology levers compared to Amazon.
Overall moat strength: strong, but not expanding as fast as Amazon’s.
Takeaway for Investors
Amazon’s moat continues to deepen as its high-margin businesses scale. Technology, data, network effects, and Prime ecosystem lock-in create competitive barriers that widen over time.
Walmart’s moat remains resilient but mature. Its strength lies in stability, efficiency, and dominant physical infrastructure — but it lacks the same technological flywheel that propels Amazon.
If you prioritize:
- Innovation, expanding moats, and long-term optionality → Amazon stands out
- Operational excellence, reliability, and sustained scale advantage → Walmart delivers
Which Looks More Attractive Overall?
After combining all six analytical pillars (revenue growth, margin development, free cash flow, valuation, solvency, and management/moat strength), the picture becomesclear:
Amazon leads on every performance-driven metric: growth, margins, profitability, FCF generation, valuation, and PEG.
Walmart leads on financial stability and predictability, with a stronger solvency profile and lower operational volatility.
From a strategic standpoint, Amazon also benefits from a widening competitive moat, driven by AWS, advertising scale, logistics technology, and an innovation-focused management team.
Walmart’s moat remains durable but mature, reflecting operational excellence rather than rapid structural expansion.
Investor takeaway
- If you want a stable, defensive, predictable compounder → Walmart is the better fit.
- If you want superior long-term return potential with accelerating fundamentals → Amazon is decisively more attractive.
Summary Comparison Table: Amazon vs. Walmart
Category | Why It Matters | Amazon (AMZN) | Walmart (WMT) | Winner |
Revenue Growth | Indicates demand & competitive strength | ~11% (2026E) | ~5% (2026E) | Amazon |
Gross Margin | Business-model efficiency | ~51% | ~24–26% | Amazon |
Net Income Margin | Final profitability | ~10.8% | ~3.1% | Amazon |
Free Cash Flow | True value creation | ~$45B (2026E) | ~$16B (stable) | Amazon (growth) |
Valuation (P/E) | What you pay for earnings | ~31× | ~40× | Amazon |
PEG Ratio | Price relative to growth | ~1.6 | ~5.0 | Amazon |
Solvency | Financial stability & balance-sheet strength | Moderate, improving | Very stable | Walmart |