

If you’ve ever tried to evaluate a stock and found yourself drowning in numbers, you’re not alone. Most investors start by looking at common figures like the price to earnings ratio or earnings per share, but quickly realize those numbers raise more questions than answers. Without the right structure, these metrics are easy to misuse and relying on them blindly can lead to poor decisions.
The truth is, stock metrics only become powerful when used in context. A company might show impressive revenue growth but have razor-thin profit margins. Another may report strong net income while quietly accumulating dangerous levels of debt. That’s why the smartest investors analyze stocks across five essential dimensions: growth, margins, cash flow, return, financial health, and valuation.
Each of these areas reveals something different. Growth metrics help you understand demand and momentum. Margin metrics uncover cost control and pricing power. Return metrics show how well management is using capital to generate profits. Financial health metrics assess risk and stability. Valuation multiples tell you whether the stock is cheap or overpriced compared to industry peers or the broader market.
This guide breaks down each category with clarity and practical insight. You’ll learn how to interpret popular value investing metrics like P/E, ROE, and debt-to-equity, and how to apply them to real-world decisions. We’ll also cover how to use these tools alongside data from financial statements, and how to separate short-term noise from long-term value.
Whether you’re researching a fast-growing tech firm or a stable dividend-paying stock, understanding these financial metrics will give you an edge. By the end, you’ll know how to read the numbers the way professional investors doc and, more importantly, how to act on them with confidence.
What Are Stock Metrics?
Stock metrics are the backbone of fundamental analysis. They are quantitative tools that help investors measure a company’s economic performance, assess its financial risk, and estimate its future potential. These metrics are not just numbers on a page. They are signals that, when interpreted correctly, guide smarter and more informed investment decisions.
Each metric is derived from one of three core financial statements: the income statement, the balance sheet, or the cash flow statement. From these documents, investors calculate a variety of financial ratios and activity ratios. These allow for meaningful comparisons between companies, across time, and against industry benchmarks or industry peers.
When applied properly, stock metrics help investors:
- Forecast future performance based on trends in growth, earnings, or efficiency
- Analyze business operations and capital allocation strategy
- Evaluate financial stability including liquidity and leverage
- Compare valuation and profitability against historical performance or industry standards
The key to using these metrics effectively is context. No single number tells the full story. That’s why the best analysis groups metrics into functional categories. In this guide, we break them down into five: growth, margins, cash flow, return and profitability, financial health, and valuation. Each group answers a specific question about a company’s true condition and future potential.
1. Growth Metrics: Tracking Expansion and Demand
Growth metrics are essential for understanding how well a company is expanding its revenue base and scaling operations. These indicators help investors evaluate whether a business is gaining traction in its market and capturing demand efficiently. For growth investors, these metrics are often the first stop in identifying high-potential companies.
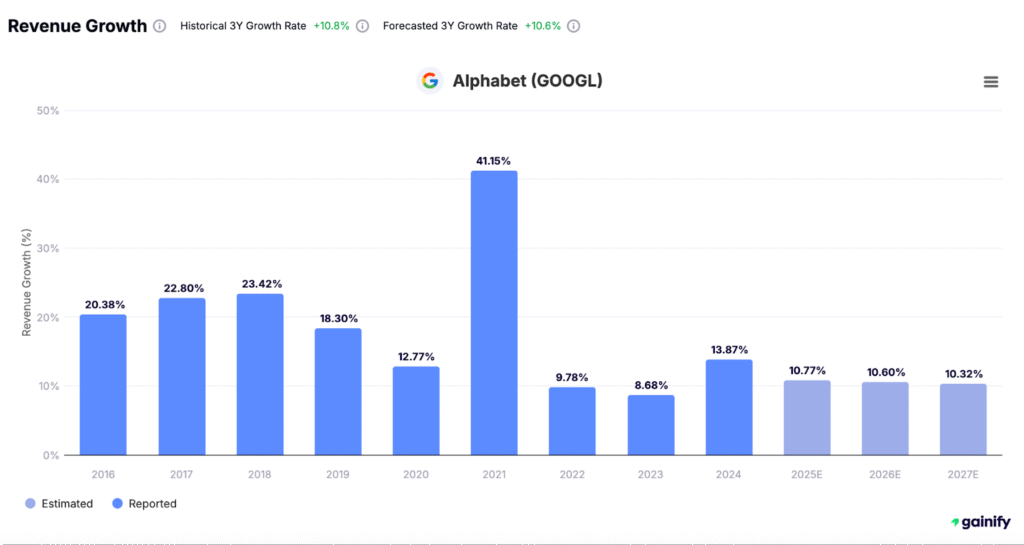
- Revenue Growth: This measures the annual increase in a company’s top-line sales. Consistent revenue growth often reflects strong customer demand and a scalable business model. For context, always compare a company’s growth to industry trends..
- Earnings Growth Rate: This tracks the rate at which earnings per share (EPS) is increasing over time. A healthy earnings growth rate is crucial for long-term returns and is a core input for calculating the PEG ratio, which adjusts valuation by growth expectations.
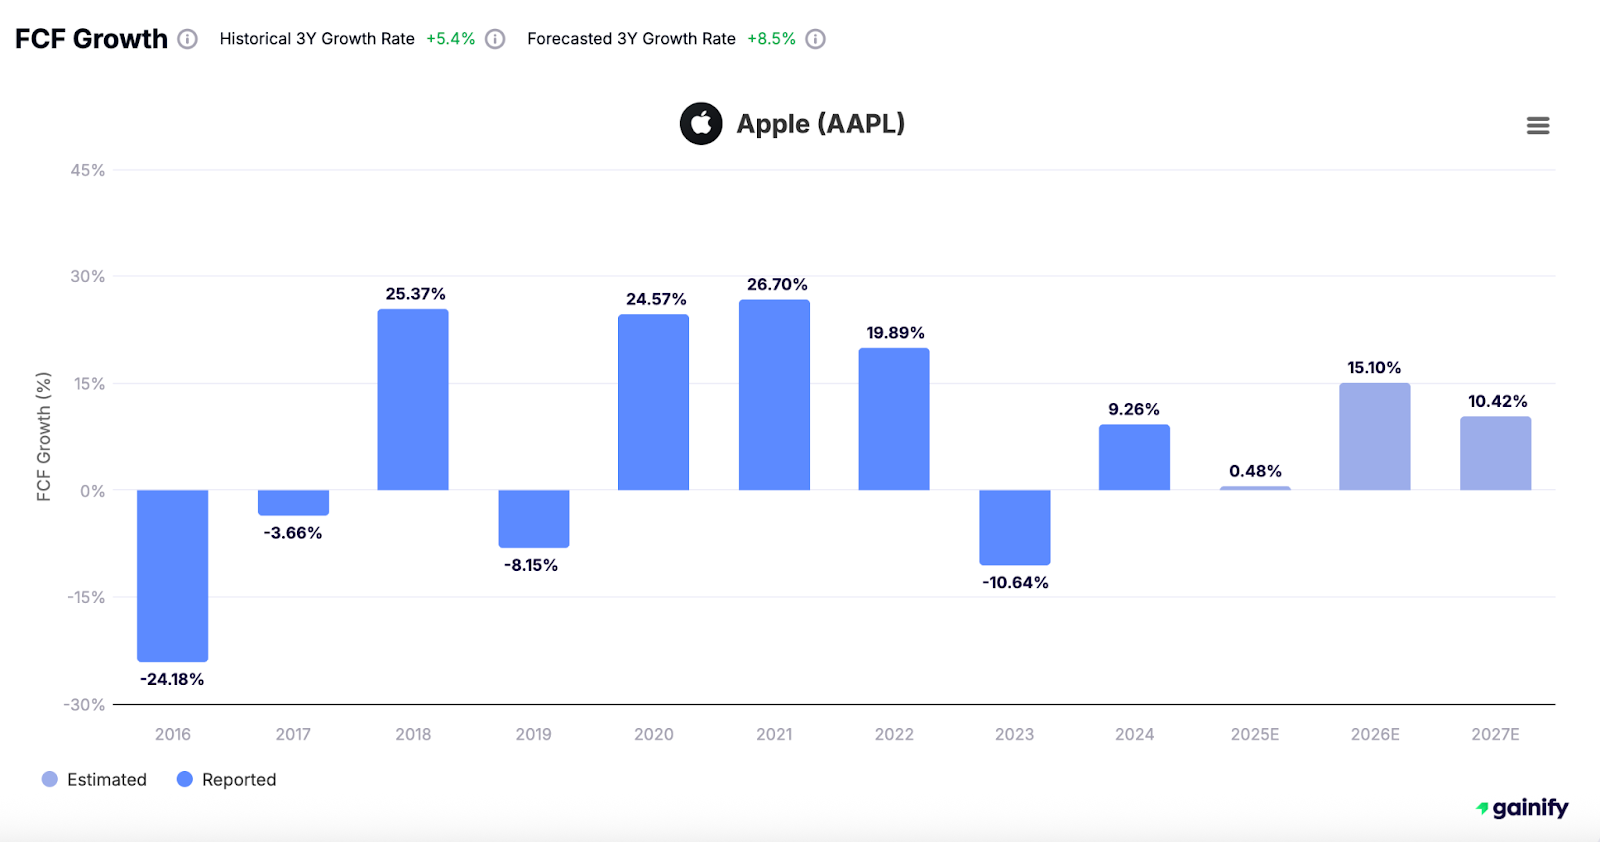
- Free Cash Flow Growth: This reflects how much excess cash a company generates after covering its capital expenditures. Rising free cash flow suggests the company is not just growing but doing so with solid financial discipline, making it more resilient over the long term.
It’s important to watch out for growth that is driven by unsustainable factors, such as increasing debt levels or high costs of investment. True quality growth is accompanied by improving margins and strong profitability ratios. Always assess growth in conjunction with return metrics to ensure you’re not mistaking risk for momentum.
2. Margin Metrics: Understanding Profitability and Costs
Margin metrics are critical for evaluating a company’s ability to turn revenue into real profit. They reveal how well a business manages its costs and whether it has pricing power in its market. Companies with strong and stable margins are often more resilient, especially in volatile or competitive industries.
- Gross Margin: Measures how much is left after subtracting the cost of sales and raw materials from revenue. A high gross margin suggests the company can maintain healthy profits even as costs fluctuate.
- Operating Margin: Evaluates how efficiently a company runs its core operations by accounting for operating expenses and indirect costs. It is a reliable indicator of day-to-day business efficiency.
- Net Margin: Reflects the percentage of revenue left after all expenses, including taxes and interest. This is crucial for income investors who prioritize long-term profitability and dividend potential.
Track how these margins trend over time, especially during different phases of the business cycle. Also consider the company’s margin of safety – its ability to withstand cost pressures or revenue slowdowns. Businesses with high margin volatility or margin debt should be reviewed with caution.

3. Cash Flow Metrics: Measuring Real Earnings Power
Cash flow metrics give a more accurate picture of a company’s financial health and flexibility than net income alone. Since accounting profits can be influenced by non-cash items and timing differences, cash flow-based indicators are considered more reliable for assessing true performance.
- Operating Cash Flow (OCF): Reflects the cash generated from a company’s core operations. This is a critical indicator of whether the business can sustain its day-to-day activities.
- Free Cash Flow (FCF): Measures the cash remaining after capital expenditures. A growing FCF indicates the company has enough resources to invest, reduce debt, or return capital to shareholders.
- Cash Flow Margin: Calculates operating cash flow as a percentage of revenue. It’s a good measure of operational strength and the ability to convert sales into real cash.
- Cash Flow Yield: Compares free cash flow to market capitalization. This helps determine whether a stock is producing enough real return relative to its current valuation.
Strong cash flow metrics often signal high financial flexibility, especially in times of economic uncertainty. Companies that consistently generate more cash than they spend are in a better position to weather downturns and capitalize on new opportunities.
4. Return and Profitability Metrics: Evaluating Efficiency
Return and profitability metrics help investors understand how well a company transforms capital into earnings. These indicators are crucial for evaluating management effectiveness, business quality, and long-term shareholder value. High returns on capital suggest that a company is not just growing, but doing so in a way that adds real economic value.
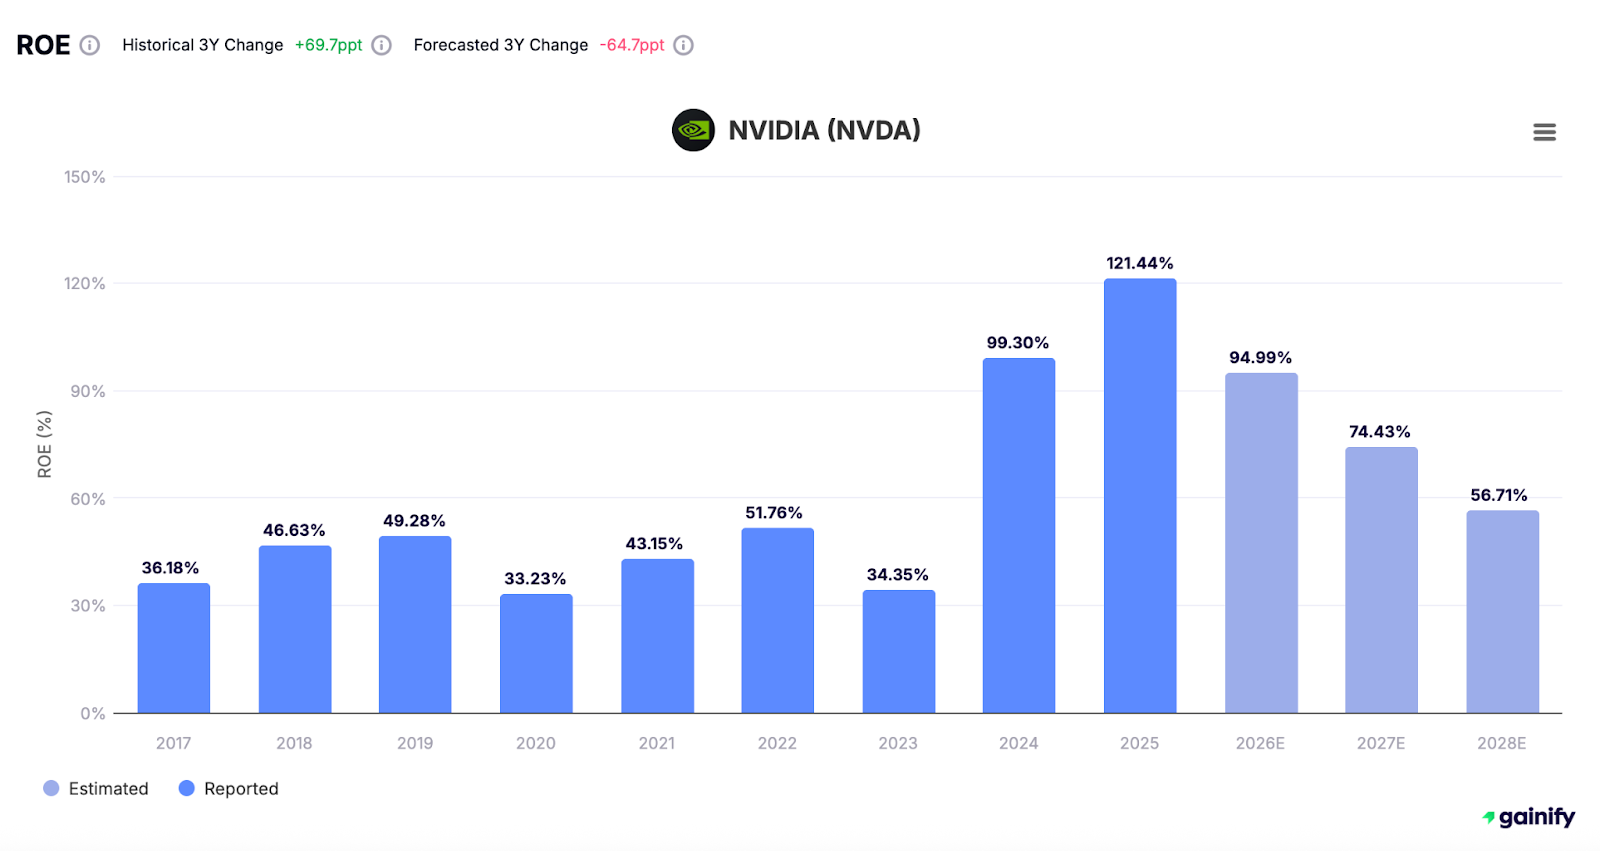
- Return on Equity (ROE): Measures net income relative to common shares. This ratio is most meaningful when debt levels are consistent, as high leverage can distort the true return being generated.
- Return on Assets (ROA): Evaluates how effectively a company uses its total asset base, including both tangible assets and intangible assets such as goodwill.
- Return on Invested Capital (ROIC): Provides a clear view of how well the company is deploying all forms of capital, including both equity and debt. This is a critical metric for comparing industry peers with different capital structures.
You can deepen your analysis by including efficiency ratios such as asset turnover. These ratios complement return metrics by highlighting how well a company utilizes its resources, especially in capital-intensive industries. Cash flow-specific metrics are covered separately, as they provide a more complete view of real earnings strength and financial resilience.
5. Financial Health Metrics: Measuring Stability and Risk
Financial health metrics reveal how well a company can withstand economic stress and meet its financial obligations. These ratios are critical for identifying balance sheet strength, liquidity risk, and the sustainability of capital structures. A company can be profitable on paper yet fragile in a crisis if its financial health is weak.
- Debt-to-Equity Ratio: Measures the proportion of financing coming from debt relative to equity. A high ratio may signal aggressive borrowing, while a low ratio suggests more conservative financial management.
- Current Ratio: Evaluates a company’s ability to meet its short-term current liabilities with liquid assets. A ratio above 1.5 is generally considered healthy, though standards vary by industry.
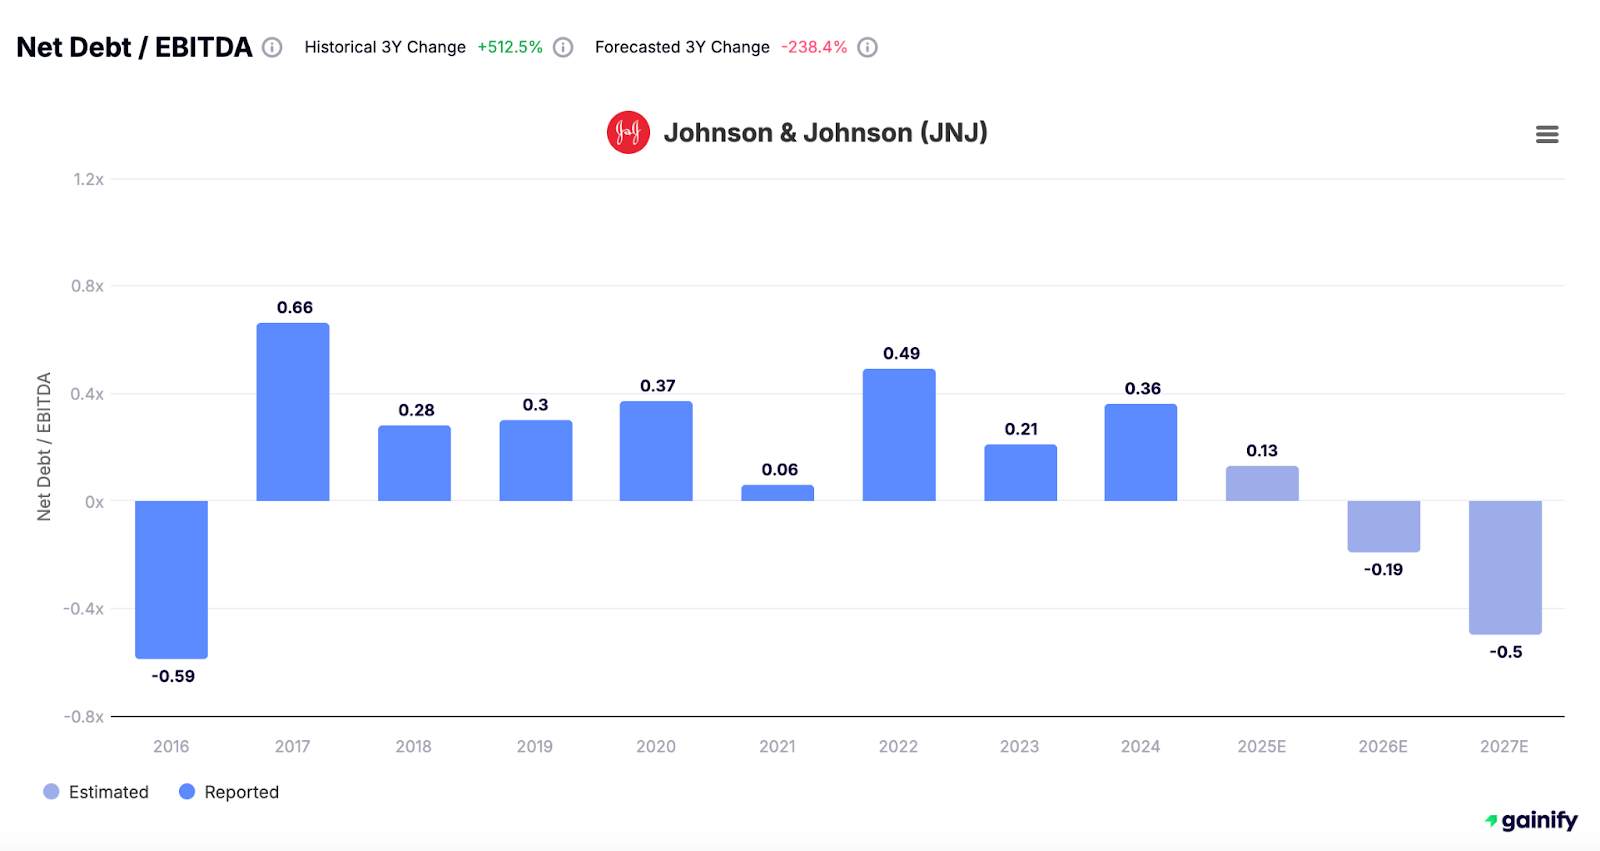
- Net Debt to EBITDA: Indicates how many years it would take to pay off all debt using earnings before interest, taxes, depreciation, and amortization. This is a key measure for credit analysts and institutional investors.
- Interest Coverage Ratio: Assesses how many times a company can cover its interest expenses using operating profits. A ratio below 1 signals potential trouble meeting debt obligations.
These ratios help determine a company’s ability to fund operations, service obligations, and maintain access to credit. Firms with strong financial health are more likely to survive downturns, retain investor confidence, and pursue growth when competitors are forced to retreat. Financially sound companies are more likely to survive downturns, retain investor confidence, and pursue growth when competitors cannot.
6. Valuation Multiples: Determining the Right Price
Valuation multiples help investors determine whether a stock is fairly priced, overvalued, or trading at a discount. These ratios are essential for comparing companies across industries and assessing how much the market is willing to pay for a company’s earnings, assets, or revenue.
- Price to Earnings Ratio (P/E): Indicates how much investors are paying for each dollar of earnings per share. A high P/E may reflect strong growth expectations, while a low P/E could indicate undervaluation or financial risk.
- PEG Ratio: Adjusts the P/E ratio by factoring in the company’s earnings growth rate. This is useful for identifying whether a stock’s valuation is justified by its growth potential, helping avoid misleading “value traps.”
- Price to Book Ratio (P/B): Compares the stock’s market price to its book value per share. This is especially relevant in asset-heavy industries like real estate, finance, and industrials.
- Price to Revenue / Share: Also known as the sales ratio, this metric compares price per share to revenue per share. It is commonly used for subscription-based businesses and firms that are not yet profitable.
To build a complete valuation profile, investors should also consider how each valuation ratio compares to industry standards and historical averages. Valuation is never about a single number. It is about interpreting what the market is pricing in compared to what the underlying fundamentals truly justify.
Bonus: Dividend and Ownership Metrics
Dividend and shareholder metrics help investors understand how income is distributed and how a company’s capital structure affects individual ownership. These indicators are especially important for those focused on dividend income, dilution risk, or transparency in governance.
- Dividends per Share and Payout Ratio: Show what portion of net income is distributed to shareholders. Consistent or rising dividends can signal strong cash flow and disciplined capital allocation, but a payout ratio that is too high may limit future investment flexibility.
- Shares Outstanding: Affects all per-share calculations, including earnings per share, cash flow per share, and valuation multiples. Monitoring changes in the share count can reveal trends, which impact existing shareholder value.
- Preferred Shares: Typically come with fixed dividends and different rights than common shares. These can influence a company’s cost of capital and determine payout priority during liquidation.
Additionally, reviewing insider trading activity, and levels of institutional ownership can provide insights into governance quality. These signals help investors determine whether company leadership is aligned with long-term shareholder interests.
A Contrarian Take: Metrics Aren’t Everything
Metrics are powerful, but they are not the whole story. Many investors rely heavily on financial ratios without asking deeper questions: What drives the business forward? Who makes the critical decisions? Can this company adapt to change? While metrics help identify patterns and performance, they cannot predict innovation, execution quality, or strategic missteps.
- A company might look flawless on paper with strong margins, consistent growth, and attractive valuation. Yet, it can still underperform due to poor decision-making, weak leadership, unfavorable industry trends or a flawed business strategy.
- Broader economic factors such as rising interest rates, inflation, and geopolitical tensions can undermine even the most financially sound firms. These risks often escape the scope of quantitative models.
- Disruptive companies operating in emerging industries or building unconventional products may appear overvalued by traditional standards. However, their future growth potential may only be visible through qualitative insight.
Effective investing combines quantitative discipline with qualitative reasoning. You must understand the company’s business model, assess its leadership team, evaluate customer loyalty, and place it in the context of evolving industry trends. Numbers inform your view, but real insight comes from seeing the full picture. The best investors are not just number crunchers, but they are strategic thinkers who balance data with foresight.
Final Thoughts
Stock metrics are powerful tools for understanding a company’s financial foundation, but they must be used with care. They provide structure, consistency, and comparability, but they represent only one side of the investment equation.
To make truly informed decisions, combine fundamental metrics with context. Understand how the company operates, how it competes, and where it fits in the broader economic and industry landscape. Pay attention to trends over time, and always ask why the numbers look the way they do.
Metrics help you screen, compare, and quantify. But great investing also requires judgment, experience, and an eye for nuance. Numbers tell part of the story. The rest comes from understanding the management, strategy, and market forces that drive the business forward.
FAQs About Stock Metrics
Q: What is the most important stock metric to look at first?
A: Start with the price to earnings ratio, revenue growth, and earnings growth rate. These offer a basic sense of whether a stock is fairly valued and if the business is expanding profitably.. These offer a basic sense of whether a stock is fairly valued and if the business is expanding profitably.
Q: How do stock metrics help in stock purchase decisions?
A: They offer a structured way to evaluate a company’s valuation, growth potential, and financial health. This allows you to make decisions based on facts rather than emotion or hype.
Q: Are stock metrics the same as financial ratios?
A: Many stock metrics are financial ratios, such as ROE, current ratio, and efficiency ratio. Others may be derived directly from raw financial data but still serve a similar analytical purpose.
Q: Where can I find accurate stock metrics?
A: Use public company filings (like 10-Ks and 10-Qs), platforms like Gainify, or databases that include industry benchmarks, company KPIs, and other financial reporting tools.
Q: What if a company has strong earnings but weak liquidity?
A: Dig deeper using cash flow-based metrics such as Cash Flow Yield or Operating Cash Flow Ratio. It’s also helpful to examine Days of Inventory, inventory turnover rate, and inventory shrinkage to understand how well the business is managing working capital.