

Return on Assets (ROA) is a foundational financial ratio used to assess how effectively a company utilizes its asset base to generate net earnings.
As a key performance indicator in both equity research and corporate finance, ROA bridges the income statement and balance sheet to reveal how well management converts assets into profits.
From an investor’s standpoint, ROA functions as an efficiency benchmark that transcends company size and capital structure, making it particularly useful when comparing companies across a sector. It is calculated by dividing Net Income by Average Total Assets over a given period..
In this guide, we’ll explain how ROA is calculated, how to interpret it, and why it’s an essential component of sound financial analysis for both short-term evaluation and long-term investment strategy.
Key Takeaways
- Efficiency metric: ROA shows how much profit a company generates for each dollar of assets.
- Simple formula: ROA = Net Income ÷ Average Total Assets, typically using beginning and ending assets for the period.
- Industry dependent: Asset-heavy sectors tend to have lower ROA than asset-light sectors, so comparisons work best within an industry.
- Quality signal: Rising ROA can indicate improving operational efficiency or better capital allocation.
What is Return on Assets (ROA)?
Return on Assets (ROA) is a profitability ratio that measures how effectively a company uses its assets to generate net income.
In simple terms, it shows how much profit a business produces for each dollar invested in assets.
ROA is calculated by dividing net income by average total assets, which helps smooth out changes in asset levels during the period. Because it incorporates both earnings and asset base, ROA provides a direct view into operational efficiency.
In practical terms, a higher ROA indicates that management is using the company’s assets more efficiently, while a lower ROA suggests weaker asset utilization or a more capital-intensive business model.
Return on Assets (ROA) Formula
Return on Assets (ROA) = Net Income ÷ Average Total Assets

Where:
Net Income: Found at the bottom of the income statement. This is the company’s profit after taxes and expenses.
Average Total Assets: Calculated by averaging the total assets at the beginning and end of the period (usually a fiscal year). It includes both current assets and long-term assets such as property assets, intangible assets, and specialized equipment.
ROA Calculation: Simple Example
Example: If a company earns $1 million in net income and has $10 million in average total assets, its ROA is:
ROA = $1,000,000 / $10,000,000 = 10%
Interpretation: A 10% ROA means the company generates 10 cents of profit for every dollar of assets, indicating efficient use of its asset base.
Why ROA Matters for Investors
ROA helps answer a fundamental question: How efficiently is a company deploying its resources?
- Measures Operating Efficiency: A higher ROA indicates that a company is generating more profit relative to its asset base. This highlights strong asset efficiency, especially important for asset-intensive companies such as major oil companies, banks, and auto companies.
- Enables Meaningful Comparisons: ROA enables comparisons across companies of varying sizes and capital structures. It is particularly useful when analyzing asset-light companies like a software company or service business versus asset-heavy ones like an airline company or utility companies.
- Links Financial Statements: ROA provides insight into the profitability of assets by combining data from both the income statement and the balance sheet accounting equation. It offers a more comprehensive picture than other ratios in business.
- Provides Strategic Insight: ROA can uncover capital-intensive companies with strong operational incomes or asset-light companies achieving exceptional returns due to efficient resource allocation and effective property management.
- Reveals Capital Allocation Quality: Companies that maintain or grow ROA while expanding their asset base (through asset purchases or additional assets) tend to have disciplined and efficient management. This is essential in avoiding poor capital investment decisions.
Key Considerations When Using ROA
ROA is a useful tool, but like any profitability ratio, its interpretation depends heavily on context:
- Industry Norms: ROA varies based on industry averages. For example, a retail industry business may show a different ROA compared to a banking industry or gas industry firm due to the nature of their economic resources and cost structures.
- Capital Intensity: In capital-intensive businesses like infrastructure or manufacturing, ROA tends to be lower because of expensive assets and higher capital expenditures. This should not be confused with inefficiency.
- Timing Adjustments: Always use average assets over the time period in question rather than year-end balances to get an accurate measure of performance between periods. This approach accounts for changes due to inventory purchases, the sale of vehicles, and depreciation of equipment.
- Accounting Differences: Consider how differences in financial reporting frameworks (GAAP vs. IFRS), asset impairments, or depreciation affect total asset values and income assumptions. Using unbiased content and reputable publishers or white papers can help ensure accurate, standardized comparisons.
- One-Time Events: Factors such as the sale of equipment or property investments can create temporary spikes in income level and distort ROA. Understanding these events is vital for making informed decisions.
What Is a Good Return on Assets (ROA)?
A “good” Return on Assets depends entirely on industry and business model. ROA should not be judged against a single universal threshold because asset intensity varies significantly across sectors. The same ROA can signal strong performance in one industry and weak performance in another.
ROA is most useful when evaluated relative to industry peers or compared against a company’s own historical performance over time.
How ROA Varies by Industry
- Technology and software: Typically asset-light businesses. ROA is structurally higher, and low single-digit ROA may indicate inefficiency, while double-digit ROA often reflects strong asset utilization.
- Consumer goods and healthcare: Require moderate asset investment. ROA is usually lower than software but higher than heavy industry, with mid-single-digit ROA often representing healthy performance.
- Manufacturing, utilities, and infrastructure: Highly capital-intensive sectors. ROA is naturally lower, and even low-single-digit ROA can be competitive within the industry.
- Banks and financial institutions: ROA is structurally low because assets consist mainly of loans and financial instruments. ROA below 1% is common, and small changes in ROA are economically meaningful.
Key takeaway
ROA measures efficiency, not absolute profitability. Its value comes from contextual comparison, not from hitting a fixed percentage target.
ROA vs. ROE and ROIC
ROA is often compared with Return on Equity (ROE) and Return on Invested Capital (ROIC). While all three measure profitability, they answer different questions and should be used in different contexts.
Metric | What It Measures | Formula |
Return on Assets (ROA) | Net income generated per dollar of assets | Net Income / Average Total Assets |
Return on equity capital | Net Income / Shareholders’ Equity | |
Return on Invested Capital (ROIC) | NOPAT / (Equity + Debt – Cash) |
How to Use Each Metric
- Use ROA to evaluate asset efficiency and operational performance
- Use ROE to assess shareholder returns, while accounting for leverage
- Use ROIC to judge whether a company is creating value above its cost of capital
Limitations of Return on Assets (ROA)
While Return on Assets is a useful efficiency metric, it has important limitations that must be understood to avoid misleading conclusions.
Key Limitations to Keep in Mind
- Highly industry dependent: ROA varies widely by sector due to differences in asset intensity. Comparing ROA across unrelated industries can lead to incorrect conclusions.
- Distorted by accounting choices: Depreciation methods, asset write-downs, and differences between GAAP and IFRS can materially affect asset values and net income.
- Affected by one-time events: Asset sales, impairments, or unusual gains can temporarily inflate or depress ROA, masking underlying performance.
- Less useful for financial firms: For banks and insurers, assets are core to operations rather than capital investments, making ROA less informative on a standalone basis.
- Ignores capital structure impact: ROA does not account for how a company is financed, which is why it should be used alongside ROE and ROIC.
How to Use ROA Responsibly
ROA should never be used in isolation. It is most effective when combined with peer comparisons, multi-year trend analysis, and complementary metrics such as margins, ROE, and ROIC.
Key takeaway
ROA measures asset efficiency, not business quality on its own. Context, industry norms, and supporting metrics are essential for accurate interpretation.
Real-World ROA Examples
Understanding how top companies perform on ROA offers valuable perspective. Here are three well-known firms across sectors, each illustrating different ROA dynamics:
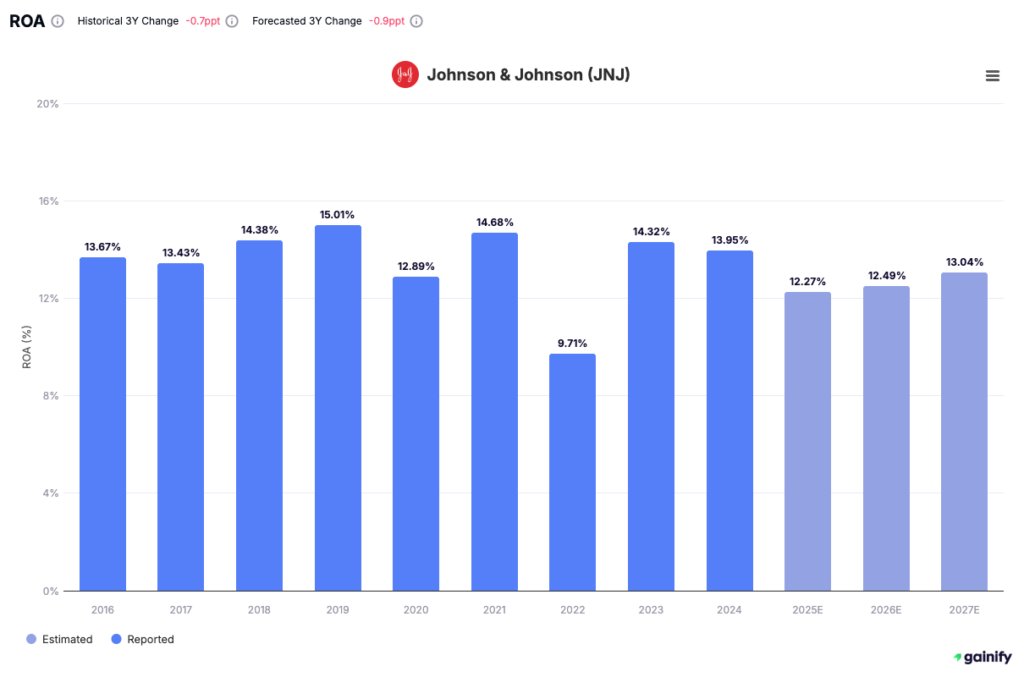
- Johnson & Johnson (JNJ): ROA ~12–13%
Strong performance from diversified healthcare products with solid asset efficiency in a moderately capital-intensive business model.
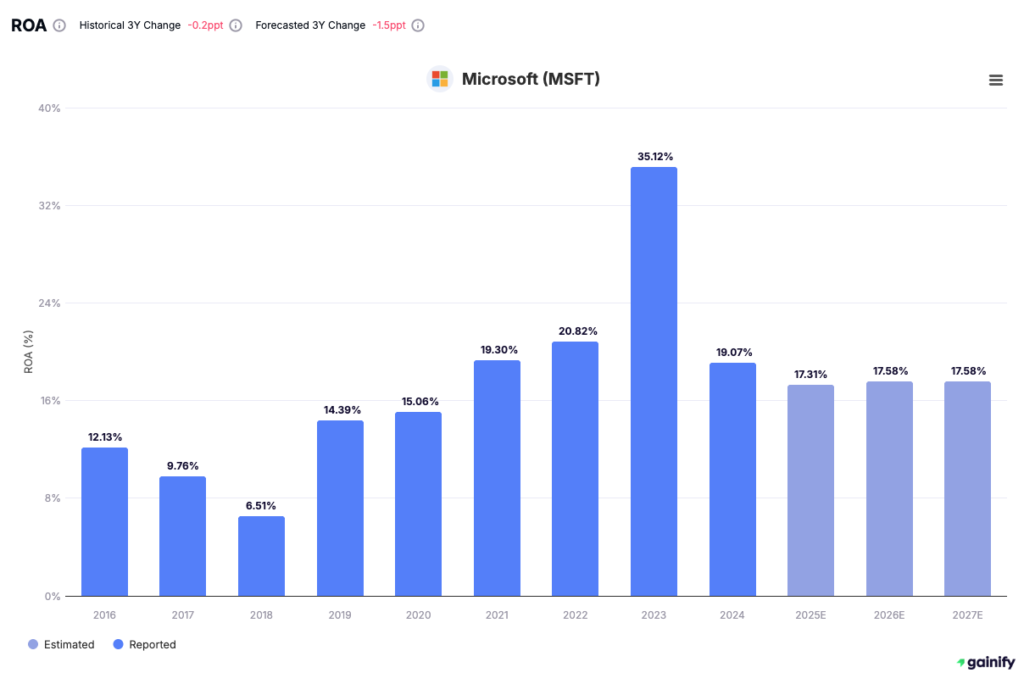
- Microsoft Corp. (MSFT): ROA ~18–21% – A leading tech company with scalable operations and a lean asset structure. Illustrates how asset-light companies can achieve high returns using fewer resources.
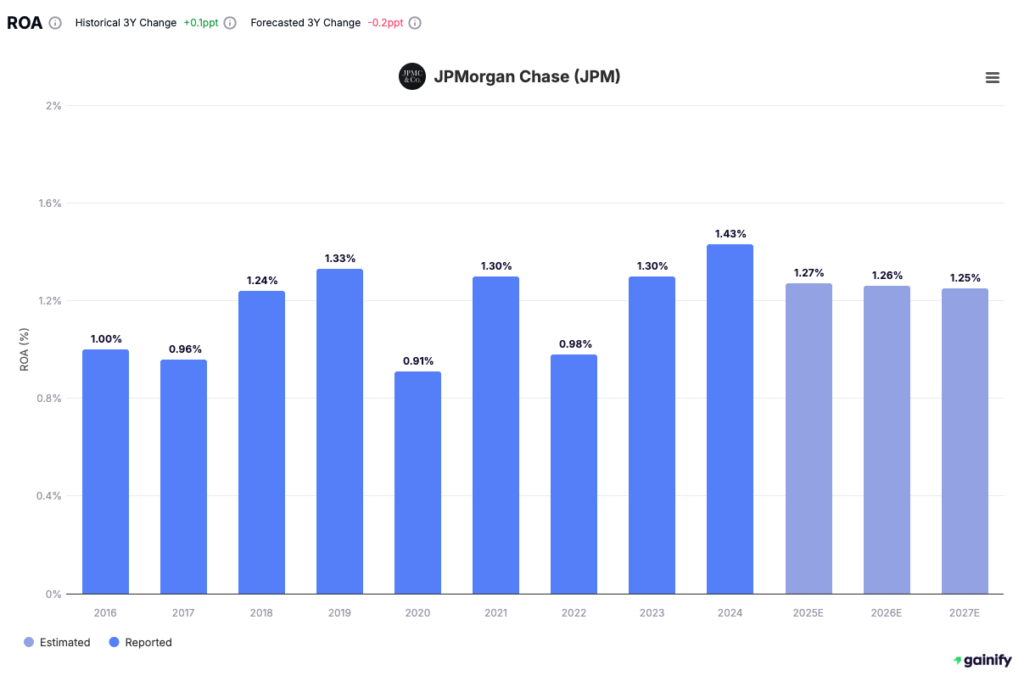
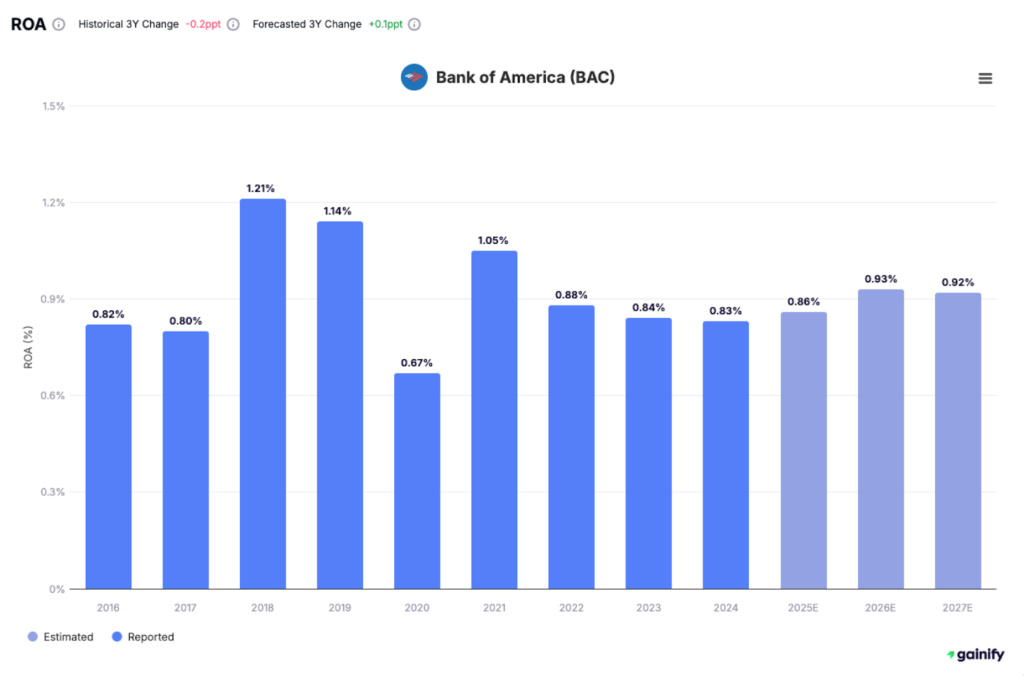
- Bank of America (BAC): ROA <1.0%
Typical for banks with large property assets, current investments, and accounts receivable tied to customer deposits and loans. Despite low ROA, this reflects the nature of the banking industry.
These companies highlight how to apply ROA in real-world scenarios and make performance comparisons among peer companies within their respective sectors.
Final Thoughts: Using ROA Effectively
Return on Assets is a powerful tool for evaluating how efficiently a company turns resources into profit, but its value lies in how it is applied, not in the number itself. ROA works best as a relative measure, comparing companies within the same industry or tracking performance over time.
Used correctly, ROA helps investors identify disciplined management teams, capital-efficient business models, and early signs of operational improvement or deterioration. Used incorrectly, without industry context or supporting metrics, it can easily mislead.
For the most accurate insights, ROA should be viewed alongside ROE, ROIC, margins, and cash flow trends. Together, these metrics provide a more complete picture of profitability, capital allocation, and long-term business quality.
In short: ROA tells you how hard a company’s assets are working. The real insight comes from understanding why that return exists and whether it is sustainable.