
For most investors, the hardest part of investing is not placing a trade. The real challenge is knowing WHERE TO START.
The stock market is vast. Thousands of companies are listed across regions, industries, and exchanges. It is easy to feel overwhelmed.
One of the best ways to uncover opportunities is by building a shortlist of stocks that match your strategy. Instead of chasing tips or scanning endless tickers, use tools that cut through the clutter and surface only the companies that matter.
Why Use a Stock Screener?
A stock screener acts like a filter for the stock market. Rather than manually reviewing reports one by one, you set the rules — like “companies under $50B market cap, free cash flow yield above 4%, and revenue growth over 10%.” In seconds, the screener delivers a curated list of stocks that fit.
This makes screeners powerful for:
- Idea generation → uncovering companies you might otherwise overlook.
- Efficiency → shrinking hours of research into minutes.
- Risk management → filtering out businesses with weak fundamentals.
- Strategy alignment → staying focused on growth, value, or dividend plays.
And when it comes to choosing a tool, Gainify stands out among the best stock screeners in the industry, giving you more than 1,000 searchable metrics, 10 years of history, 3 years of forward-looking estimates, and global coverage in one platform.
Why Gainify Is a Next-Generation Stock Screener
Many screeners exist, but Gainify is built for investors who want depth and precision. It’s not just a filter tool — it’s a full research engine designed for modern investing.
Here’s why Gainify stands out:
➡️ 1,000+ searchable metrics: covering income statement, balance sheet, cash flow, dividends, ratios, valuations, and analyst estimates.
➡️ 10 years of historical data: track long-term trends in revenue, earnings, margins, and capital structure.
➡️ 3-year forward forecasts: evaluate companies not just on past performance but also on expected growth and profitability.
➡️ Global reach: filter by region, industry, or exchange to focus on your target universe.
➡️ Comprehensive toolkit: everything from market cap and FCF yield to ROIC and dividend payout ratio in one platform.
With Gainify, you truly get everything you would need to move from initial screening to deeper investment research in minutes.
Step-by-Step Screening Process with Gainify
Before diving into the details, it helps to break the screening process into clear steps. Gainify makes this simple by guiding you from defining your universe, to applying filters, to combining them into actionable strategies.

Step 1: Define Your Investment Universe
The first step is to set the boundaries of your search. Gainify lets you choose:
- Region – e.g., United States, France, United Kingdom, China.
- Industry – Technology, Healthcare, Semiconductors, Energy, etc.
- Exchange – NASDAQ, NYSE, or other international listings.
This ensures you’re only looking at the stocks relevant to your goals. For example, a U.S. tech investor could filter by United States + Technology + NASDAQ.

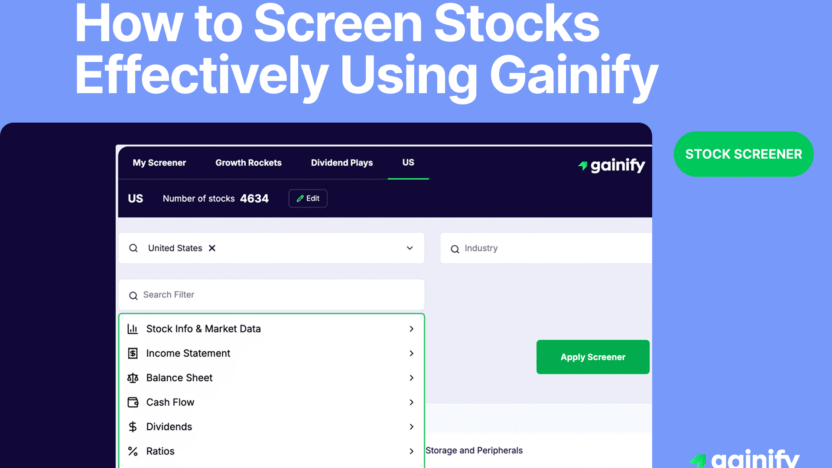
Step 2: Apply Screening Filters
Once you have defined your universe, the next step is to drill down with filters. Gainify offers one of the widest libraries of metrics available to retail investors, covering every part of financial analysis. You can screen by:
- Stock Info & Market Data: market cap, beta, RSI, year-to-date price performance
- Income Statement: revenue, gross profit, EBITDA, EPS
- Balance Sheet: cash holdings, total assets, capital structure, total debt, working capital
- Cash Flow Statement: free cash flow, capex, operating cash flow
- Dividends: yield, payout ratio, growth, dividends per share (DPS)
- Valuations: P/E, EV/EBITDA, price-to-book, price-to-sales (both trailing and forward)
- Estimates: revenue, EBIT, EPS forecasts, analyst rating trends. Gainify provides the largest forward-looking dataset available to retail investors
- Ratios: margins, growth, return on equity or capital, and solvency metrics
The flexibility is enormous. With more than 1,000 searchable elements, you can combine dozens of criteria to build screens tailored to your exact strategy, whether you are looking for undervalued cash-flow generators, high-growth disruptors, or reliable dividend payers.

Step 3: Combine Filters to Surface Opportunities
The power of Gainify comes from combining multiple conditions at once. Let’s look at two practical examples:
Example 1: Mid-Cap Growth with Strong Cash Flow
- Market Cap < $50B
- Free Cash Flow Yield > 4%
- Revenue Growth (Next Year) > 10%
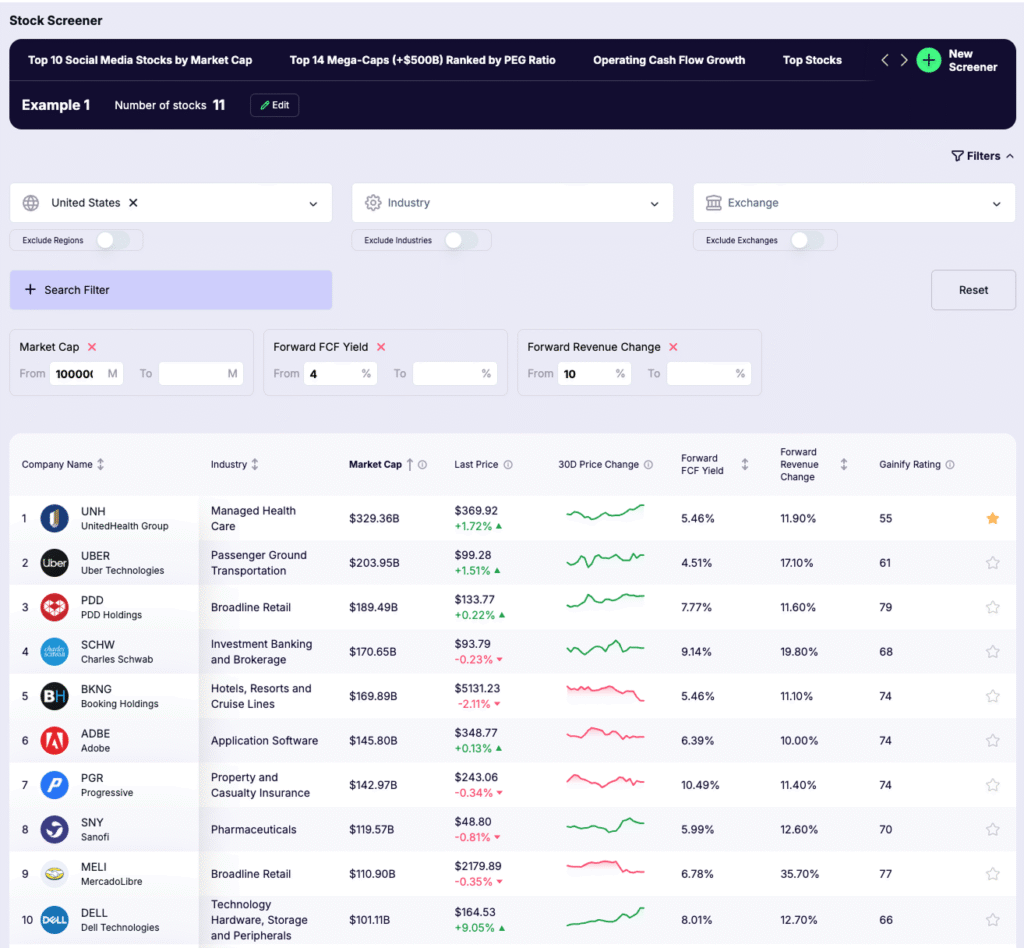
👉 This screen surfaces mid-cap companies with healthy free cash flow and double-digit growth forecasts, often overlooked by the market but rich in upside potential.
Example 2: Dividend Value with Balance Sheet Discipline
- Market Cap > $50B
- Forward Dividend Yield > 3%
- Forward Payout Ratio < 70%
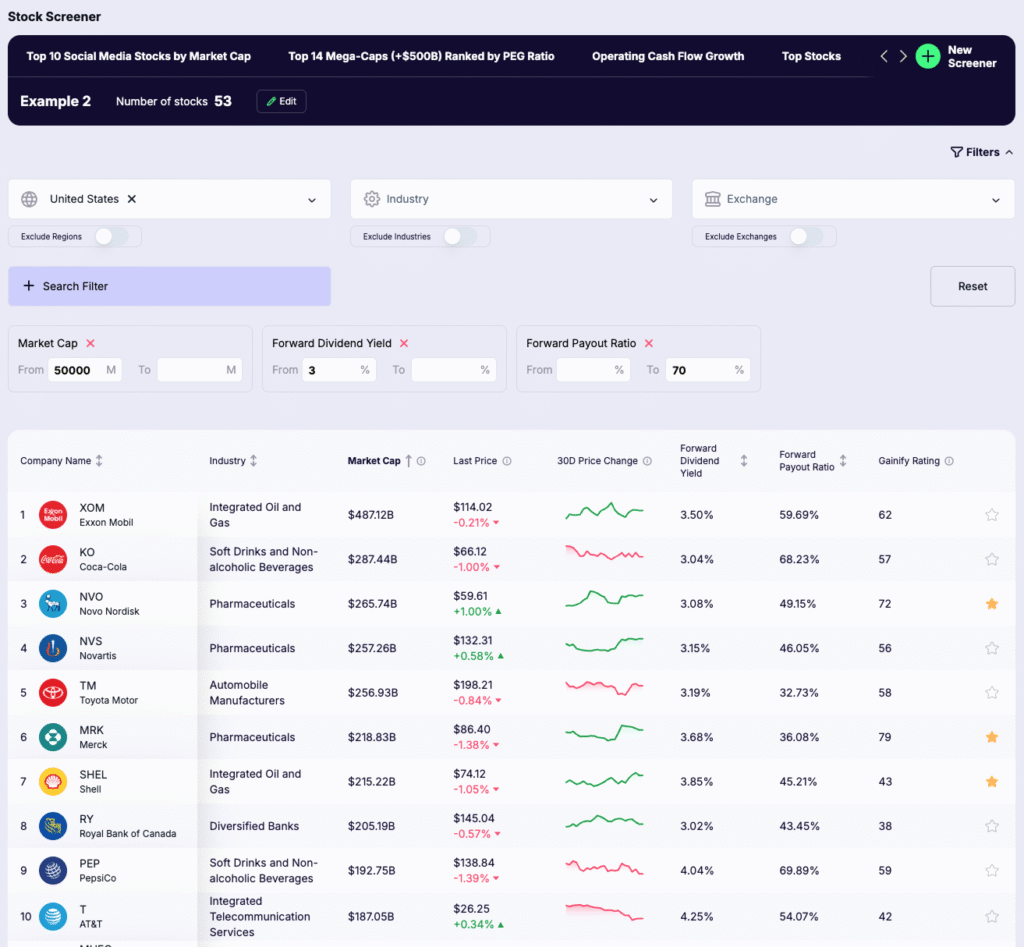
👉 This screen surfaces large-cap dividend payers that not only provide attractive yields but also keep payout ratios at sustainable levels.
The Bottom Line
Stock screening is the first step to smart investing and using the best free stock screener, like Gainify, makes the process efficient, flexible, and data-driven. With global coverage, more than 1,000 metrics, 10 years of historical data, and 3 years of forecasts, Gainify gives you the tools to go beyond simple filters and build strategies tailored to your exact needs.
✅ Whether you’re hunting for fast-growing mid-caps, undervalued dividend plays, or stable blue chips, Gainify puts everything you would need at your fingertips.