
Most people buy stocks the way others buy lottery tickets based on hope, hype, or someone else’s conviction. The rare few who succeed long term approach investing very differently.
If you want to outperform the stock market over the long term, you need a consistent process for stock analysis. This is especially true in tech, where high growth, market hype, and complex business models can cloud judgment.
The best investors don’t just look at price. They look under the hood. They understand the business, the market dynamics, the financial statements, and the valuation that affect long-term returns.
In this guide, you’ll learn how to analyze a stock before investing – step by step – with a focus on long-term tech investing. We’ll cover everything from fundamental analysis and technical analysis to key financial metrics and qualitative signals that really matter.
1. Understand the Business Model Before Anything Else
Before you look at a P/E ratio, stock chart, or income forecast, you need to answer this:
What does the company actually do, and how does it make money?
Start by breaking it down into key components:
- The core product or service: What exactly is the company selling? Is it software, hardware, data infrastructure, financial services, or physical goods?
- The customer base: Is the company targeting other businesses (B2B) or consumers (B2C)? This affects pricing power, the length of the sales cycle, customer retention, and revenue predictability.
- The pricing model: Does the business rely on recurring revenue, usage-based pricing, transaction fees, or one-time purchases? Subscription models offer more stable and predictable cash flow, while usage-based models may scale faster but introduce variability.
- Total addressable market (TAM) and market share potential: How big is the opportunity? A niche solution in a $1 billion market offers different upside than a scalable platform in a $100 billion market.
- The competitive landscape: Who are the main competitors? Does the company compete on product, pricing, distribution, or ecosystem? Is it a first mover or a late entrant?
This is the core of qualitative analysis, the part of investing that cannot be modeled in a spreadsheet. It helps uncover hidden strengths, weaknesses, and assumptions baked into the stock’s current price.
Consider Snowflake ($SNOW). It is a B2B cloud data platform that charges customers based on how much data they use. Its usage-based pricing aligns revenue with customer growth. Snowflake operates in a large and expanding cloud data infrastructure market, serving some of the world’s biggest enterprises.
Now compare that to Shopify ($SHOP), which offers a platform for small businesses to run online stores. Shopify earns revenue through SaaS subscriptions and by taking a cut of merchant transactions. Although both companies are considered tech firms, their revenue models, customer bases, cost structures, and growth dynamics are fundamentally different.
This type of understanding is essential. It shapes how you interpret the company’s financial statements, how you project future growth, and how you assess its stock market valuation.
Investors who ignore business model clarity often get caught off guard during earnings reports or macro shifts. On the other hand, investors who understand the business deeply are better equipped to assess risk, ignore noise, and hold with conviction when others panic.
2. Dig Into the Financial Statements (Fundamentals Matter)
Once you understand the business model and how the company makes money, the next step is to analyze the numbers behind the story.
This means reviewing the company’s financial statements, which provide a detailed, verifiable picture of how the business is performing. These documents are filed quarterly and annually with the Securities and Exchange Commission (SEC) and are publicly available to all investors.
There are three core financial statements every investor should know:
- Income Statement: This report shows the company’s revenue, expenses, and net profit or loss over a period of time. It tells you whether the business is growing and whether that growth is profitable.
- Balance Sheet: This statement outlines the company’s assets, liabilities, and equity. It reveals the book value of the business and gives insight into financial strength and solvency.
- Statement of Cash Flows: This report shows how much actual cash is being generated or consumed by operations, investing, and financing activities. It helps distinguish between accounting profits and real cash movement.
Understanding these statements is essential to conducting fundamental analysis. They form the basis for many of the most important financial ratios used in stock analysis.
From these statements, you can calculate a range of critical financial ratios. Below are 10 essential metrics, all grounded in real financial data:
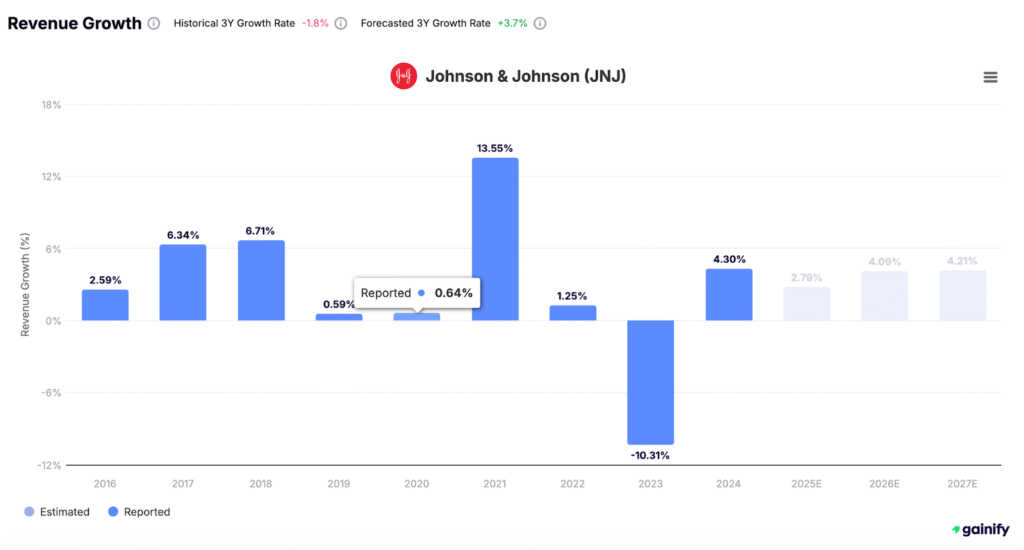
A. Revenue Growth Rate
Source: Income Statement
Measures how quickly the company’s top-line sales are growing over time. Strong, consistent growth indicates product-market fit and rising demand.
Formula:
(Current Period Revenue − Prior Period Revenue) ÷ Prior Period Revenue
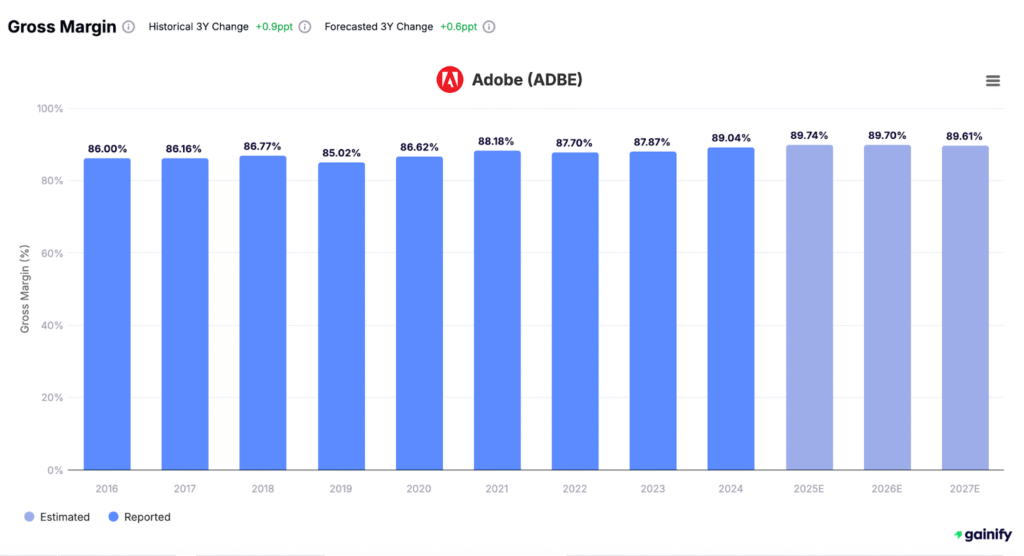
B. Gross Margin
Source: Income Statement
Shows how much revenue remains after covering the direct costs of producing goods or services. High margins suggest pricing power and operational efficiency.
Formula:
Gross Profit ÷ Revenue × 100
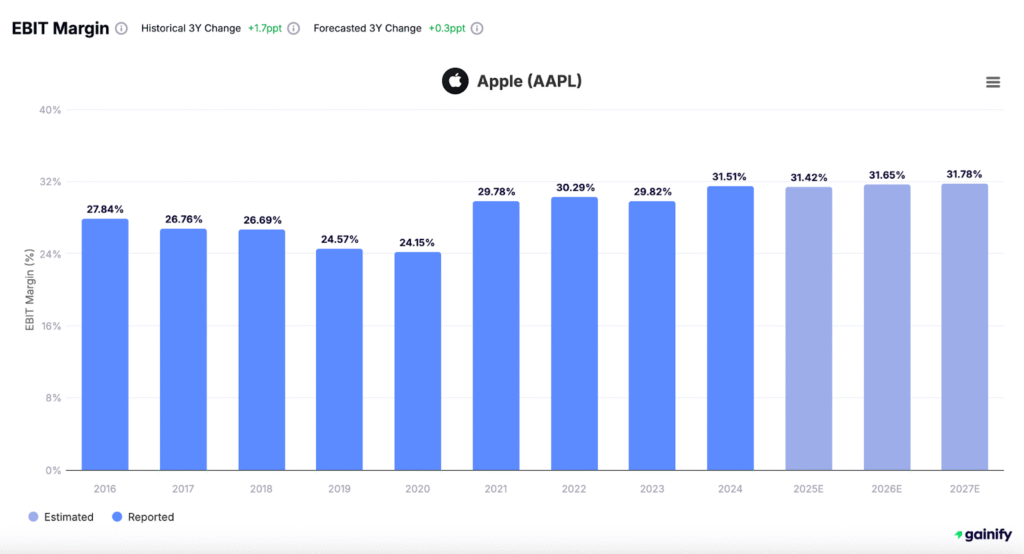
C. Operating Margin
Source: Income Statement
Measures how much profit the company makes after covering operating expenses, but before interest and taxes. Reflects core business efficiency.
Formula:
Operating Income ÷ Revenue × 100
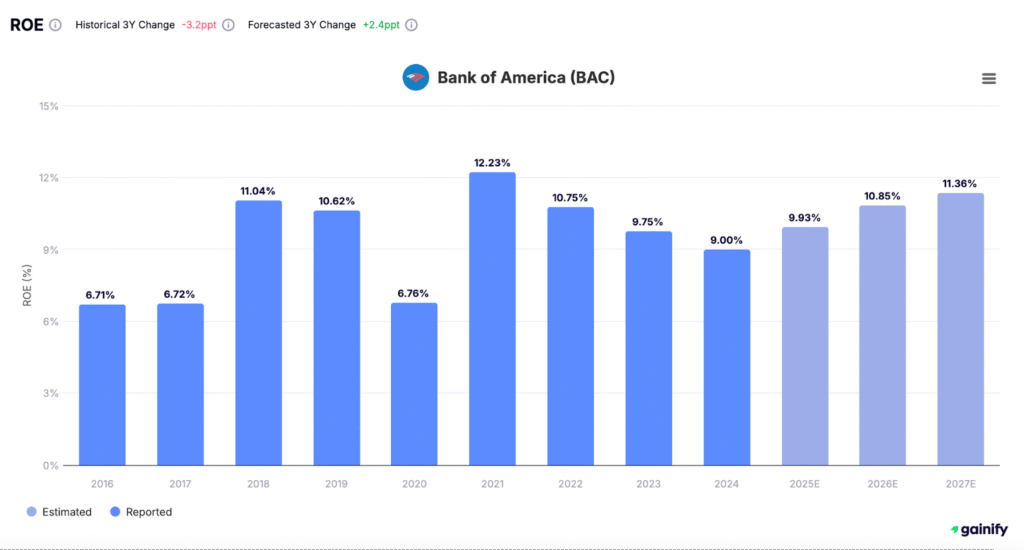
D. Return on Equity (ROE)
Source: Income Statement and Balance Sheet
Indicates how well the company generates profits from shareholders’ equity. A higher ROE is generally better, but it should be sustainable and not driven by excess leverage.
Formula:
Net Income ÷ Average Shareholders’ Equity × 100
E. Return on Invested Capital (ROIC)
Source: All Three Statements
Measures how efficiently a company uses all forms of capital (equity and debt) to generate returns. ROIC above the company’s cost of capital is a strong sign of value creation.
Formula:
Net Operating Profit After Tax ÷ Invested Capital × 100
F. Free Cash Flow Margin
Source: Cash Flow Statement and Income Statement
Indicates how much of the company’s revenue turns into free cash flow, which is available to reinvest, pay down debt, or return to shareholders.
Formula:
Free Cash Flow ÷ Revenue × 100
G. Debt-to-Equity Ratio (D/E)
Source: Balance Sheet
Evaluates the company’s financial leverage by comparing total debt to shareholder equity. A high ratio may signal higher risk in a downturn.
Formula:
Total Liabilities ÷ Shareholders’ Equity
H. Debt-to-EBITDA Ratio
Source: Income Statement and Balance Sheet
Measures the company’s ability to service debt using its earnings. Lower is better, particularly in volatile industries.
Formula:
Total Debt ÷ EBITDA
I. Current Ratio
Source: Balance Sheet
Shows whether the company has enough short-term assets to cover its short-term liabilities. A ratio above 1 indicates sufficient liquidity.
Formula:
Current Assets ÷ Current Liabilities
J. Interest Coverage Ratio
Source: Income Statement
Measures how easily the company can pay interest on its outstanding debt. Higher ratios mean greater financial safety.
Formula:
EBIT ÷ Interest Expense
It is critical not to rely on a single year of data. Financial results can fluctuate due to one-time events, macro conditions, or seasonal effects. Instead, review these figures over a five-year period to uncover meaningful trends.
A company with steady improvement in margins, cash flow, and returns on capital is far more attractive than one that posts irregular spikes followed by declines. In long-term investing, consistency and resilience often matter more than short bursts of performance.
The goal of this analysis is not just to check boxes. It is to gain conviction through evidence that the company has a financially sound foundation capable of supporting growth, even during market turbulence.
3. Focus on the Right Metrics for Tech Stocks
In Section 2, we focused on the foundational financial ratios used across all industries – metrics like revenue growth, gross margin, operating margin, return on equity, return on invested capital, free cash flow margin, and key leverage and liquidity ratios. These give a powerful baseline for evaluating any business.
Now, we shift focus to additional metrics that are especially useful when analyzing technology companies. These measures are not duplicative; rather, they help you go deeper into understanding scalability, retention, customer economics, innovation efficiency, and shareholder alignment, which are all critical when evaluating long-term tech investments.
Net Revenue Retention (NRR)
NRR tells you how much recurring revenue a company retains from its existing customers, including expansions, upgrades, and churn. It is one of the most important indicators of customer satisfaction and product value in SaaS and subscription models.
- An NRR above 120 percent is excellent.
- This metric reflects organic growth from existing accounts without relying on new customer acquisition.
- You can often find NRR disclosed in earnings reports or investor presentations, even if it does not appear in GAAP financials.
Lifetime Value to Customer Acquisition Cost (LTV Ratio to CAC)
This ratio compares how much it costs to acquire a customer versus how much that customer is expected to generate in total gross profit during their relationship with the company.
Formula:
Lifetime Value ÷ Customer Acquisition Cost
- A ratio of 3 or higher is considered sustainable.
- If LTV is low relative to CAC, the business may be overspending on growth.
- This metric combines insights from both the income statement and marketing spend and is especially relevant for high-velocity or B2B software models.
Deferred Revenue Growth
Deferred revenue represents payments received for products or services not yet delivered. It is recorded as a liability but is a strong leading indicator of future revenue and business momentum.
- Rapidly rising deferred revenue signals strong upfront demand.
- Consistent growth in deferred revenue improves cash flow and revenue visibility.
- You can find this figure on the balance sheet and in the notes to financial statements.
Research and Development (R&D) Efficiency
Tech companies spend heavily on R&D, but not all spending creates future value. R&D efficiency helps you assess whether that investment is turning into real business growth.
Formula:
Revenue Growth Rate ÷ R&D Spend as a Percentage of Revenue
- A higher number indicates that the company converts R&D into growth more efficiently.
- Compare R&D efficiency across direct competitors in the same vertical.
Sales Efficiency (Magic Number)
This metric measures how effectively a company turns sales and marketing expense into new revenue. It is commonly used in SaaS and high-growth B2B software.
Formula:
Quarterly Revenue Growth × 4 ÷ Prior Quarter’s Sales and Marketing Expense
- A value of 0.75 or higher is considered healthy.
- A number above 1 suggests very strong sales efficiency; below 0.5 may indicate sales team inefficiency or product-market misalignment.
Gross Dollar Retention (GDR)
Unlike NRR, which includes expansion, GDR measures the percentage of recurring revenue retained from customers excluding upsells or cross-sells.
- A GDR above 90 percent is considered strong.
- GDR isolates churn risk, making it valuable for evaluating customer loyalty and product stickiness.
Annual Recurring Revenue (ARR) Per Employee
This metric measures how efficiently a company scales its recurring revenue relative to headcount. It is especially relevant for high-growth software businesses.
Formula:
Annual Recurring Revenue ÷ Total Employees
- Higher ARR per employee reflects operational leverage and efficient team scaling.
- Compare against peers with similar pricing and customer types.
Share Dilution Rate
This measures how much the company is diluting shareholders through stock-based compensation or new share issuance.
Formula:
(Current Shares Outstanding − Prior Period Shares) ÷ Prior Period Shares
- Excessive dilution erodes long-term shareholder value, even in companies with high growth.
- Review dilution trends across multiple years, not just one quarter.
Why These Metrics Complete the Picture
These metrics are not found in basic screening tools, which is why choosing the best stock analysis tools matters. They require reading investor materials, studying the cash flow statement, or calculating custom ratios. That effort pays off.
They help you understand what accounting ratios cannot:
- How loyal are customers?
- How efficient is growth spending?
- How scalable is the business model?
- Is innovation paying off?
- Are you being diluted faster than the company is growing?
In the tech sector, where businesses often run at break-even or negative margins early on, these qualitative-financial hybrid metrics are critical. They help you separate businesses that are investing wisely from those burning cash without control.
Great investors do not just study companies that look good on paper. They go further. They dig into how value is created behind the scenes, how it compounds over time, and what metrics reveal the hidden health of a business.
4. Understand Valuation in Context
Valuation is not simply about finding the lowest multiple or the cheapest stock. It is about understanding what the market is pricing in and whether those expectations are reasonable given the company’s fundamentals, competitive position, and long-term growth potential.
Two companies in the same industry may trade at different multiples for good reason. One may have higher margins, faster growth, or better capital efficiency. The key is not to memorize valuation formulas, but to understand what the numbers imply about future performance.
Below are core valuation metrics particularly relevant for analyzing technology companies, especially those with different capital structures or business models.
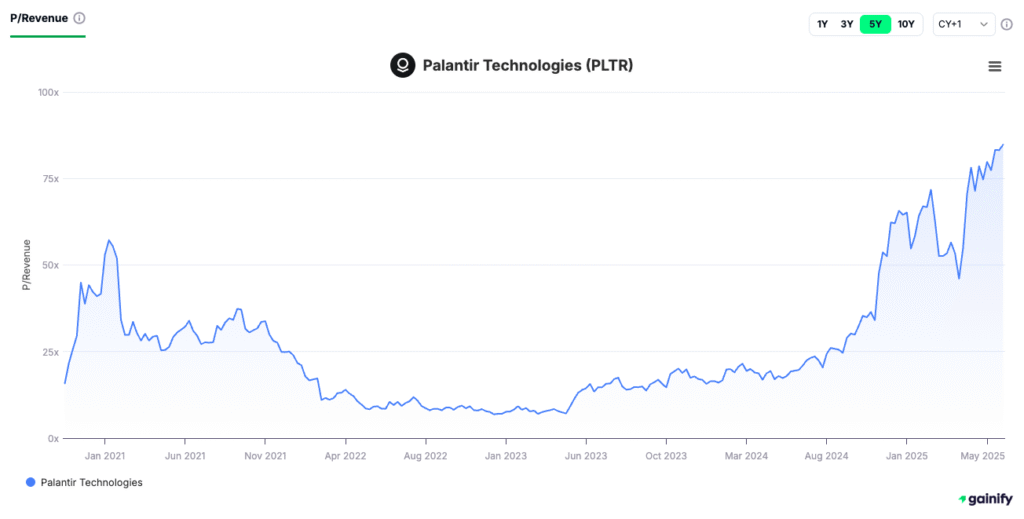
Price-to-Sales Ratio (P/S)
Why it matters: The P/S ratio is a primary valuation tool for companies that are not yet profitable. It compares a company’s market capitalization to its revenue.
Formula:
Market Capitalization ÷ Annual Revenue
- A lower P/S ratio may suggest undervaluation, but only in the context of growth and margins.
- High-growth tech companies often trade at 8 to 15 times sales; that may be justified if they have exceptional retention, expansion, or scalability.
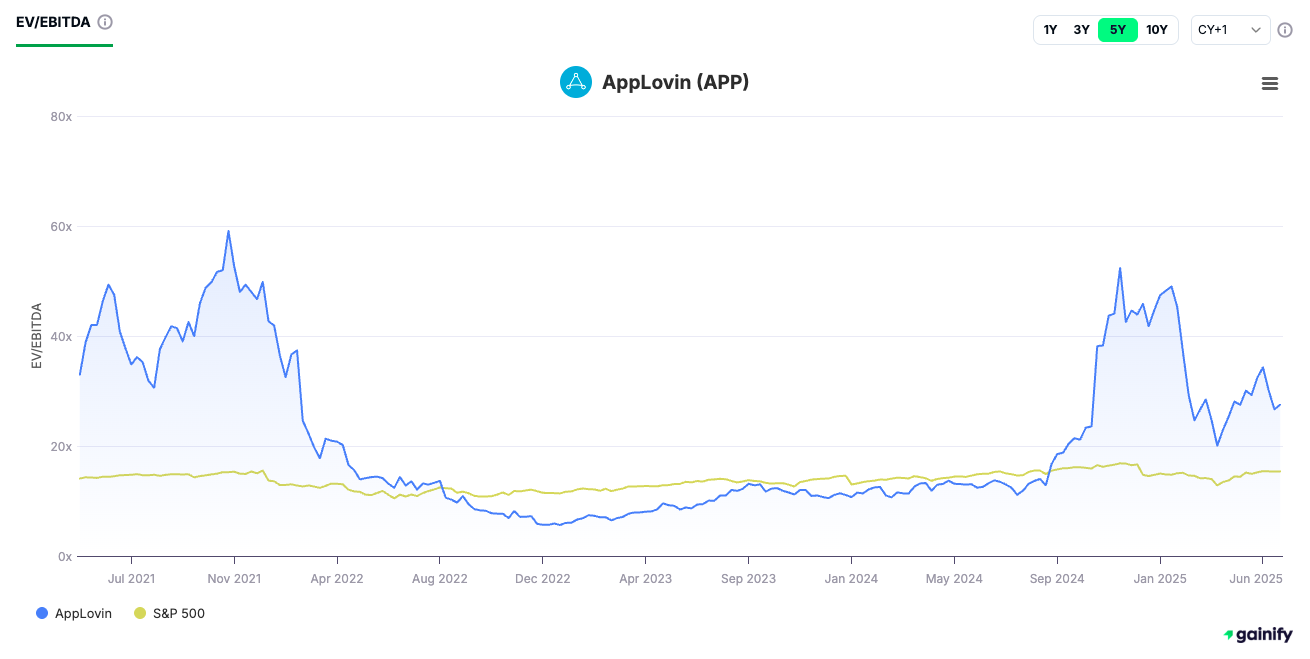
Enterprise Value to EBITDA (EV/EBITDA)
Why it matters: This ratio provides a more complete view of value by adjusting for debt and cash. It is often used to compare companies with different capital structures.
Formula:
Enterprise Value ÷ EBITDA
- Useful for evaluating larger, profitable tech companies.
- Lower values may indicate better value, but capital intensity and revenue quality must be considered.
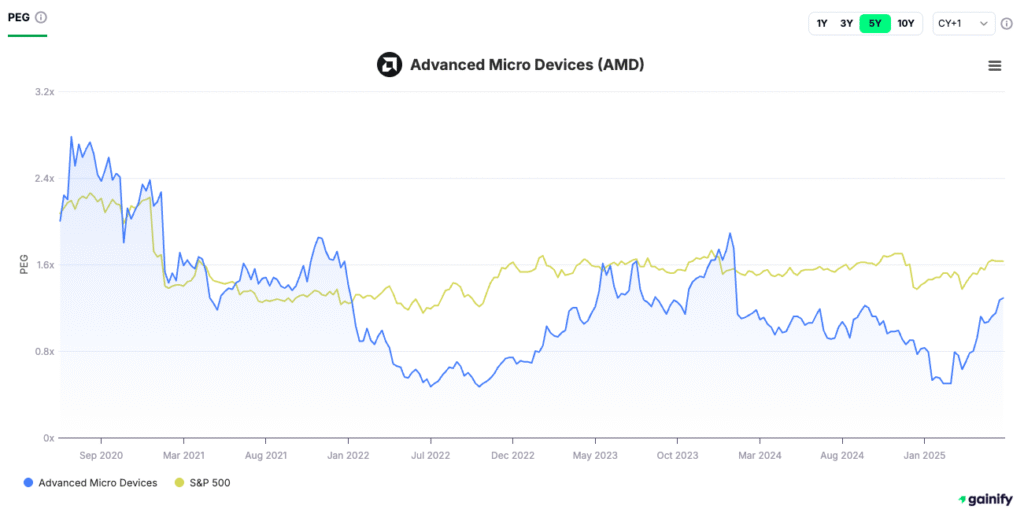
PEG Ratio (Price/Earnings to Growth)
Why it matters: The PEG ratio adjusts the P/E ratio by incorporating expected earnings growth. This helps determine if a stock is expensive relative to its future potential.
Formula:
P/E Ratio ÷ Projected Earnings Growth Rate
- A PEG ratio around 1.0 is considered fairly valued.
- A ratio below 1.0 may indicate undervaluation, while a ratio above 2.0 may reflect over-optimism.
- PEG is especially useful when comparing companies in the same growth phase.
Enterprise Value to EBIT (EV/EBIT)
Why it matters: This ratio removes the impact of depreciation and amortization while still capturing true profitability. It is especially helpful for tech firms that capitalize significant assets but remain capital-light in structure.
Formula:
Enterprise Value ÷ Earnings Before Interest and Taxes (EBIT)
- EV/EBIT is more stable than P/E and reflects core operating earnings before financial structure.
- Compare across similar firms to spot relative under or overvaluation.
Historical and Sector Comparison
No valuation ratio is useful in isolation. Always ask the following:
- How does this company’s multiple compare to its five-year average?
- How does it compare to direct competitors with similar growth, margins, and risk profiles?
- Is the current valuation reflecting optimism, pessimism, or neutrality?
For example, a SaaS company growing at 30 percent per year might trade at 10 times sales, while a slower-growing peer trades at 5 times. If the faster-growing company also has better margins, lower churn, and higher retention, the premium could be justified.
Valuation should never be viewed as a fixed number. It is a moving indicator of investor belief, sentiment, and pricing of future outcomes.
5. Technical Analysis Adds an Extra Layer
While fundamental analysis is essential for long-term investors, technical analysis can help improve timing, identify entry points, and confirm market trends.
Use the following tools:
- Moving averages: The 50-day and 200-day moving averages can help highlight longer-term uptrends or potential breakdowns in price structure.
- Candlestick charts: Useful for visualizing daily or weekly price action and identifying key patterns in investor behavior.
- Volume analysis: Adds confirmation by showing how much conviction is behind a price move, especially during breakouts or breakdowns.
- Support and resistance levels: These represent historical price points where buying or selling has repeatedly occurred. Support can act as a price floor, while resistance may act as a ceiling. Recognizing these levels can help you manage risk and improve entry timing.
Technical analysis does not replace the need for solid financials or a sound business model. However, it can help you avoid entering positions during periods of weakness or when a stock is technically overbought.
6. Evaluate the Moat and Qualitative Edge
Qualitative strength is what turns a good company into a compounding machine.
Ask:
- Is there a network effect, data advantage, or customer lock-in?
- Is the company winning market share or being disrupted?
- Is the CEO focused on investment returns and long-term goals?
Also, review risks:
- Single-point revenue dependency
- Regulatory or geopolitical exposure
- Weak capital allocation history
Understanding these factors helps you assess the company’s intrinsic value beyond just numbers.
7. Use This Long-Term Tech Stock Checklist
Before buying, run the company through this checklist:
✅ Clear understanding of the business model
✅ Strong revenue growth and gross margin
✅ Consistent cash flow generation
✅ Healthy leverage ratios (D/E and Debt-to-EBITDA)
✅ SBC is reasonable
✅ Management has a long-term focus
✅ Clear moat and competitive edge
✅ Reasonable valuation based on expected growth
✅ Positive technical setup
✅ Confidence in holding during volatility
If you check most of these, it’s time to dig deeper. If not, move on.
8. A Smarter Tool: How Gainify Can Help You Analyze Stocks
Great stock analysis takes time, but it shouldn’t be limited to institutional investors. That’s where Gainify changes the game.
Gainify.io is the most powerful AI-powered stock research app available to retail investors in 2025. Unlike platforms that focus narrowly on technical analysis or surface-level data, Gainify delivers deep, forward-looking fundamental insights, fully integrated with real-time S&P Global Market Intelligence and the world’s largest database of analyst estimates.
What makes it stand out?
- An AI stock assistant trained specifically on investing, not general-purpose chat
- Clean access to company financial statements, valuation models, and industry comparisons
- Over 500 customizable screeners, including filters for FCF margin, ROE, PEG, and more
- Real-time summaries of earnings transcripts, SEC filings, and stock-specific developments
- A proprietary 5-point Gainify Rating that scores stocks on valuation, outlook, financial health, performance consistency, and price momentum
Whether you’re researching $MSFT, $SNOW, or a lesser-known small-cap, Gainify gives you fast answers to questions that typically take hours of manual research.
You can:
- Compare top competitors in any industry
- Track what top investors and members of Congress are buying and selling
- Get instant AI-generated summaries of earnings calls
- Visualize key valuation ratios like price-to-sales, EV/EBIT, and FCF yield
- Filter for dividend payers, value stocks, or emerging leaders in AI and quantum computing
But as a research platform, Gainify gives you the kind of edge typically reserved for institutional investors. With a responsive web app accessible across desktop, tablet, and mobile, you’ll never be far from actionable insight.
If you take research seriously, Gainify can save hours of time and sharpen your investment decisions with data, not guesswork.
Final Thought: Analyze Like an Owner, Not a Follower
Stock analysis is not about predicting the future. It’s about preparing for it.
When you know how to analyze a stock before investing, you stop chasing momentum and start making intelligent bets on real businesses. You understand the business model, examine the financials, assess valuation, and weigh both risks and rewards.
You’re not just buying a ticker. You’re buying a slice of a company. The question is: would you still buy it if the market shut down for five years?
When your answer is based on process, not speculation, that’s when you’ve earned the right to hold through storms and compound wealth over time.
That is how real investors win.
FAQs: How to Analyze a Stock Before Investing
Q: What is the price-to-earnings (P/E) ratio, and when should I use it?
A: It shows how much investors are paying per dollar of earnings. Use it mainly for profitable companies. For early-stage tech, consider the price-to-sales ratio instead.
Q: What are the most useful financial statements?
A: The income statement, balance sheet, and cash flow statement are all essential. They work together to show profitability, financial strength, and real cash flow.
Q: What is intrinsic value?
A: Intrinsic value is an estimate of a company’s true worth based on future cash flows, asset value, and business quality — not just market hype.
Q: How is market capitalization different from share price?
A: Market capitalization equals share price times total shares. It represents the total value of the company and affects volatility and growth potential.
Q: Should I use technical analysis as a long-term investor?
A: Yes, as a secondary filter. Use it to avoid poor timing, not to override fundamentals.