
Volatility is one of the most important ideas in investing. For some, it means danger: unpredictable price swings that can erode wealth quickly. For others, it means opportunity: sharp movements that can create profits if timed correctly. Regardless of how you view it, volatility is an unavoidable feature of financial markets and one every investor needs to understand.
In its simplest form, volatility describes how much a stock’s price moves over time. A stable utility stock might drift only a few percent each month, while a fast-moving technology stock might rise or fall 10 percent in a single day. The more dramatic the price swings, the higher the volatility.
Most investors first learn about volatility through beta, a measure of how much a stock moves relative to the broader market, usually compared to the S&P 500 index. A stock with a beta of 1 moves in line with the market. A stock with a beta of 2 tends to move twice as much: if the market goes up 1 percent, the stock often rises 2 percent, but if the market falls, the stock tends to drop twice as far.
In this article, we’ll focus on 15 U.S. stocks with market capitalizations above $50 billion that have the highest beta values today. But before diving into the list, it’s important to understand that beta is just one way to measure volatility.
How Volatility Is Measured
Volatility can be measured in many ways, and no single measure gives the complete picture. Professional investors often look at several different metrics to evaluate how risky or unpredictable a stock or portfolio might be. Below are the six most widely used approaches, explained in detail with their strengths and limitations.
1. Beta (Market-Relative Volatility)
What it is:
Beta is the most widely cited measure of volatility. It compares how much a stock moves relative to a benchmark index, most commonly the S&P 500.
- A beta of 1.0 means the stock moves roughly in line with the market.
- A beta greater than 1.0 means the stock is more volatile than the market (for example, a beta of 2.0 suggests the stock rises or falls twice as much as the index).
- A beta below 1.0 means the stock is more stable than the market.
Why it matters:
Beta helps investors understand how a stock is likely to behave during broad market moves. For instance, if the S&P 500 rises by 5%, a stock with a beta of 1.5 would be expected to rise about 7.5%.
Limitations:
- Beta assumes the relationship between a stock and the market stays constant over time, which isn’t always true. For example, a company may become more volatile during downturns than in expansions.
- Beta treats upside and downside equally. But investors usually worry more about downside volatility than upside gains.
How investors use it:
Beta is often used in asset allocation. A conservative investor may prefer low-beta stocks to reduce portfolio swings, while an aggressive investor might seek out high-beta stocks for growth potential.
2. Historical Volatility (HV)
What it is:
Historical volatility measures how much a stock’s price has actually moved in the past. It is usually calculated as the annualized standard deviation of daily or weekly returns over a fixed period (30 days, 90 days, or 1 year).
Why it matters:
It provides a backward-looking picture of how turbulent a stock has been. A stock with high historical volatility is more likely to have unpredictable price moves.
Limitations:
- It looks only at the past. Just because a stock has been volatile does not guarantee it will stay volatile.
- It can change dramatically depending on the time frame chosen (30 days may tell a very different story from 1 year).
How investors use it:
Traders often look at short-term historical volatility to size positions and set stop-loss levels. Long-term investors may use 1-year or multi-year volatility to compare stocks when building diversified portfolios.
3. Implied Volatility (IV)
What it is:
Implied volatility is forward-looking. It comes from the options market, where traders buy and sell contracts that reflect expectations for future price swings.
Why it matters:
If implied volatility is high, it means the market expects big moves ahead. For example, implied volatility often spikes before earnings announcements, when traders anticipate surprises.
Limitations:
- IV does not predict direction (up or down). It only signals how much movement the market expects.
- It can be distorted by supply and demand for options.
How investors use it:
Options traders rely heavily on implied volatility. Stock investors can also use it as a sentiment gauge. If IV is unusually high, it may mean investors are nervous about upcoming events.
4. Downside Deviation
What it is:
Downside deviation, also called semi-deviation, looks only at negative returns. Unlike standard deviation, it ignores upside swings and focuses only on losses.
Why it matters:
It gives a clearer picture of the risk investors care about most: losing money. For conservative investors or those near retirement, downside deviation may be more relevant than overall volatility.
Limitations:
- It requires more detailed return data and is less commonly reported in stock research.
- It doesn’t capture the full distribution of returns, only the negative side.
How investors use it:
Downside deviation is often used in the Sortino ratio, which compares returns against downside risk only. Funds marketed to conservative investors sometimes highlight this ratio to show how well they manage losses.
5. Market Volatility Index (VIX)
What it is:
The CBOE Volatility Index (VIX) measures implied volatility of the S&P 500. It is derived from option prices and reflects expectations of market-wide swings.
Why it matters:
Known as the “fear index,” the VIX spikes when markets are under stress (such as during the 2008 financial crisis or the 2020 pandemic) and falls when markets are calm.
Limitations:
- The VIX does not measure volatility of individual stocks.
- It can be influenced by technical factors in the options market.
How investors use it:
The VIX provides context. If the VIX is high, investors expect turbulent markets, which can amplify volatility in individual stocks. If the VIX is low, it signals complacency and generally calmer markets.
Putting It Together
No single measure tells the whole story. Beta shows how a stock moves compared to the market. Historical volatility reveals past patterns. Implied volatility shows market expectations. Downside deviation focuses on losses, and the VIX sets the market backdrop.
Together, these tools give investors a fuller picture of volatility. In this article, we’ll use beta as our primary measure to identify the most volatile large-cap stocks in the U.S., but wise investors will consider multiple volatility measures before making decisions.
Top 15 Most Volatile U.S. Stocks (Market Cap $50B+)
Below are the 15 companies, ranked by beta, based on the data provided.
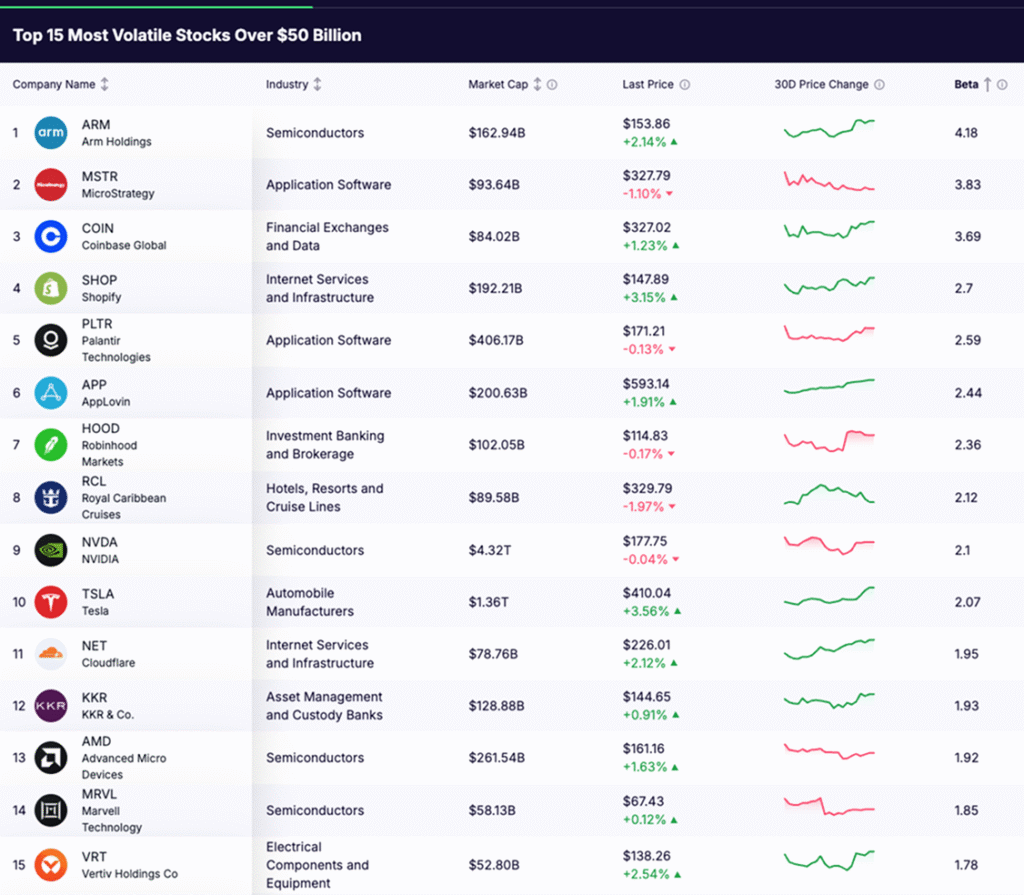
1. Arm Holdings (ARM)
- Industry: Semiconductors
- Market Cap: $159.53B
- Last Price: $150.64
- 30-Day Change: –2.62%
- Beta: 4.18
Arm Holdings tops the list with an extraordinary beta of 4.18, meaning it moves more than four times as much as the market. As a designer of chip architectures used in smartphones and servers, Arm is strategically important. But since its IPO, its stock has been highly sensitive to sentiment around semiconductors and technology more broadly. Investors should expect very sharp swings, both up and down.
2. MicroStrategy (MSTR)
- Industry: Application Software + Bitcoin
- Market Cap: $94.68B
- Last Price: $331.44
- 30-Day Change: +1.66%
- Beta: 3.83
MicroStrategy has a beta of 3.83, making it one of the most volatile large-caps. While fundamentally a software company, it is best known for holding large amounts of Bitcoin on its balance sheet. This exposure ties its stock directly to cryptocurrency moves, amplifying volatility.
3. Coinbase Global (COIN)
- Industry: Financial Exchanges and Data
- Market Cap: $83.00B
- Last Price: $323.04
- 30-Day Change: –0.28%
- Beta: 3.69
Coinbase is the largest U.S. crypto exchange. With a beta of 3.69, it is highly volatile, reflecting the boom-and-bust nature of cryptocurrencies. Investors in COIN need to be comfortable with large swings tied to regulatory news and digital asset prices.
4. Shopify (SHOP)
- Industry: Internet Services and Infrastructure
- Market Cap: $186.35B
- Last Price: $143.38
- 30-Day Change: –1.14%
- Beta: 2.70
Shopify, with a beta of 2.70, is one of the most volatile e-commerce names. Its valuation swings with interest rate expectations, consumer demand, and growth metrics. Investors should treat it as a high-growth, high-risk stock.
5. Palantir Technologies (PLTR)
- Industry: Application Software
- Market Cap: $406.69B
- Last Price: $171.43
- 30-Day Change: +4.30%
- Beta: 2.59
Palantir’s beta of 2.59 shows strong volatility. The stock reacts to government contracts, corporate adoption, and debates over valuation. It appeals to growth investors but can drop quickly when sentiment shifts.
6. AppLovin (APP)
- Industry: Application Software
- Market Cap: $196.86B
- Last Price: $582.00
- 30-Day Change: +1.87%
- Beta: 2.44
AppLovin, with a beta of 2.44, reflects the ups and downs of digital advertising. Ad spending cycles, platform policies, and user behavior all drive its volatility.
7. Robinhood Markets (HOOD)
- Industry: Investment Banking and Brokerage
- Market Cap: $102.22B
- Last Price: $115.03
- 30-Day Change: –2.31%
- Beta: 2.36
Robinhood carries a beta of 2.36. The trading platform is sensitive to retail investor activity. Bull markets drive usage and revenue; slowdowns or new regulations create sharp pullbacks.
8. Royal Caribbean Cruises (RCL)
- Industry: Hotels, Resorts, and Cruise Lines
- Market Cap: $91.38B
- Last Price: $336.42
- 30-Day Change: –3.94%
- Beta: 2.12
Royal Caribbean’s beta of 2.12 highlights the cyclical nature of travel. Demand for cruises can rebound quickly but is also vulnerable to fuel costs, economic slowdowns, and global events.
9. NVIDIA (NVDA)
- Industry: Semiconductors
- Market Cap: $4.32T
- Last Price: $177.82
- 30-Day Change: +0.37%
- Beta: 2.10
NVIDIA, with a beta of 2.10, is the largest company in the world yet remains volatile. Its dominance in AI chips makes it a market driver, but investor enthusiasm creates big swings around earnings and forecasts.
10. Tesla (TSLA)
- Industry: Automobile Manufacturers
- Market Cap: $1.32T
- Last Price: $395.94
- 30-Day Change: +7.36%
- Beta: 2.07
Tesla’s beta of 2.07 confirms its reputation as one of the most volatile mega-cap stocks. Electric vehicle adoption, competition, and leadership headlines all contribute to sharp price moves.
11. Cloudflare (NET)
- Industry: Internet Services and Infrastructure
- Market Cap: $77.13B
- Last Price: $221.32
- 30-Day Change: –1.48%
- Beta: 1.95
Cloudflare, with a beta of 1.95, reflects the volatility of cybersecurity and cloud infrastructure. Its growth potential attracts investors, but valuations can swing quickly.
12. KKR & Co. (KKR)
- Industry: Asset Management and Custody Banks
- Market Cap: $127.71B
- Last Price: $143.34
- 30-Day Change: –1.15%
- Beta: 1.93
KKR’s beta of 1.93 reflects the private equity cycle. Performance is linked to credit conditions and deal activity, which can change rapidly.
13. Advanced Micro Devices (AMD)
- Industry: Semiconductors
- Market Cap: $257.33B
- Last Price: $158.57
- 30-Day Change: +1.86%
- Beta: 1.92
AMD, with a beta of 1.92, is highly sensitive to semiconductor demand and competition. Like NVIDIA, it benefits from AI and gaming trends but carries valuation-driven volatility.
14. Marvell Technology (MRVL)
- Industry: Semiconductors
- Market Cap: $58.06B
- Last Price: $67.35
- 30-Day Change: +1.14%
- Beta: 1.85
Marvell, with a beta of 1.85, is tied to data centers and communications chips. Growth opportunities exist, but cyclicality in semis drives volatility.
15. Vertiv Holdings (VRT)
- Industry: Electrical Components and Equipment
- Market Cap: $51.49B
- Last Price: $134.84
- 30-Day Change: –0.64%
- Beta: 1.78
Vertiv’s beta of 1.78 reflects its position in power and cooling solutions for data centers. Demand is growing, but as a cyclical equipment supplier, it remains volatile.
Key Takeaways for Investors
- Technology dominates volatility. Nine of the 15 companies are in software or semiconductors. These sectors are high-growth but valuation-sensitive.
- Crypto-linked stocks swing the most. MicroStrategy and Coinbase show how digital assets amplify volatility.
- Cyclical sectors are present too. Royal Caribbean highlights that consumer discretionary can be just as volatile as tech.
- Size doesn’t eliminate swings. Even trillion-dollar giants like NVIDIA and Tesla carry high betas.
Conclusion
Volatility is neither good nor bad on its own. It is a tool. For aggressive traders, high-beta stocks like Arm, MicroStrategy, and Coinbase provide opportunities for quick gains. For long-term investors, high volatility means higher stress and greater downside risk.
The lesson is clear: know how volatility is measured, and align your portfolio with your risk tolerance and goals. High-volatility stocks can play a role in growth, but they should be balanced with more stable holdings. In practice, that means treating volatility as part of asset allocation, not something to fear or chase blindly.
By understanding the forces that drive volatility (interest rates, earnings, industry cycles, and investor sentiment), you can make smarter decisions about when and how to invest in these stocks.