
How to read stocks is widely misunderstood. Many investors believe they are analyzing businesses, when in reality they are reacting to prices. Short-term movements are mistaken for insight, volatility for information, and recent outcomes for durable truths.
Reading stocks correctly is not about forecasting near-term price movements. It is about understanding what a business fundamentally is today, what the market collectively expects it to become, and how actual outcomes may diverge from those expectations over time. Stocks rarely move because companies change overnight. They move because expectations are revised, often quietly, sometimes suddenly.

This guide lays out a rigorous, first-principles framework for how to read stocks the way long-term capital is actually deployed. It deliberately integrates business fundamentals with analyst consensus expectations, because markets do not react to absolute performance. They react to performance relative to what was already embedded in prices.
We will use Apple (Nasdaq: AAPL) as a reference point, not as an investment recommendation, but as a practical case study in high-quality corporate economics, expectation management, and the interaction between fundamentals and market perception over time.
Key Takeaways
- Stocks reprice when expectations change. Price moves are driven by surprises versus consensus, not by absolute performance or headlines.
- Business quality determines long-term value creation. Revenue durability, margin structure, cash flow generation, and capital discipline define what a company is worth over time.
- Process and patience create repeatable outcomes. A disciplined, step-by-step framework applied consistently allows long-term investors to compound capital while others react.
The Foundational Principle: Stocks Are Discounted Expectations
A stock is not valued based on what a company has already achieved. It is valued based on what the market collectively believes the business will deliver in the future, and how confident it is in that outcome. Prices therefore represent a constantly updated set of assumptions about growth, profitability, risk, and durability.
This creates two parallel dimensions that every serious investor must analyze simultaneously:
- The historical track record of the business, which reveals operating quality, competitive positioning, and management execution over time.
- Consensus analyst expectations embedded in the current price, which reflect what the market already assumes about future performance.
Stock prices do not move because results are good or bad in absolute terms. They move when reality diverges from expectations. When outcomes exceed what was priced in, valuations expand. When expectations are disappointed, even strong businesses can see sharp declines.

Understanding stocks, therefore, is ultimately an exercise in understanding both business fundamentals and market psychology, and in identifying the gap between what is expected and what is likely to occur.
Step 1: Revenue Growth in Context
Revenue growth is the logical starting point for any stock analysis, but it is only meaningful when viewed in the context of what the market already expects. Growth in isolation does not drive returns. Growth relative to expectations does.
At a minimum, analyze three dimensions:
- Five to ten year historical revenue growth, to understand the company’s scale, durability, and sensitivity across economic cycles.
- Consensus analyst revenue growth forecasts, which define the baseline assumptions already embedded in the stock price.
- The direction of change versus expectations, specifically whether actual growth is accelerating or decelerating relative to those forecasts.
The market reacts not to the level of growth, but to the surprise.
Case study example: Apple
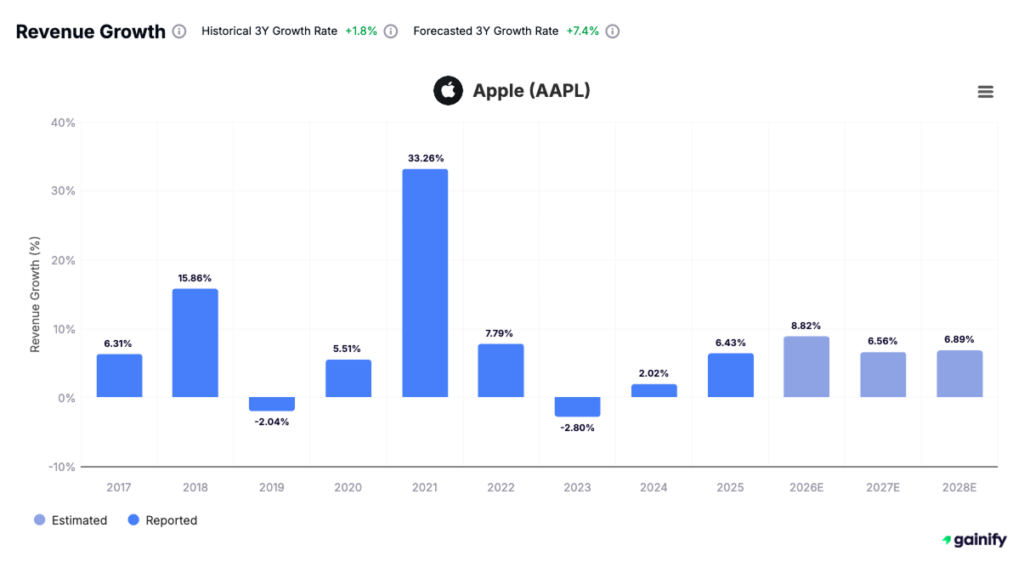
Apple’s revenue growth slowed materially in 2023 and 2024, reflecting post-cycle normalization and macro pressure, and this deceleration is fully priced into the stock. Importantly, growth begins to reaccelerate in 2025, marking a clear inflection in expectations rather than a return to prior-cycle highs.
Consensus forecasts assume revenue growth stabilizes at a higher level into 2026 and 2027, with mid to high single-digit growth sustained rather than peaking and fading. For Apple, stock performance hinges on whether this reacceleration materializes and holds. Delivering in line with these assumptions supports valuation, while any meaningful deviation from this expected path drives the next move.
Step 2: Revenue Mix
Revenue mix analysis goes beyond growth rates and answers a more important question: how durable and valuable each dollar of revenue really is. Changes in mix can materially improve earnings quality, margin structure, and cash flow stability, but only if those changes differ from what the market already expects.
At a minimum, revenue should be analyzed across three dimensions:
- Products versus services, to understand cyclicality and the degree of platform leverage.
- Recurring versus transactional revenue, which determines visibility, predictability, and downside protection.
- Margin contribution by segment, since mix shifts often drive profitability more than headline growth.
The most important questions are forward-looking:
- What does the market assume this revenue mix will look like three to five years from now?
- Is management delivering that transition faster, slower, or exactly in line with consensus expectations?
Revenue mix creates stock performance only when its evolution surprises the market.
Case study example: Apple
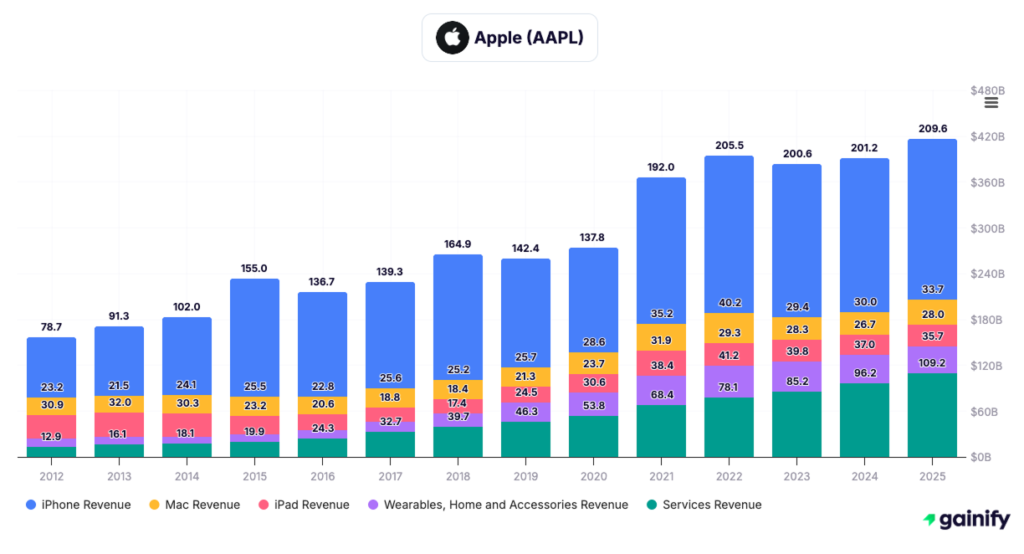
Over the last five years, Apple’s revenue mix has evolved meaningfully while maintaining a stable core. The iPhone has remained the foundation of the business, consistently contributing approximately 50 to 55 percent of total revenue, underscoring its continued relevance rather than signaling structural decline.
The most significant change has been the expansion of Services. Five years ago, Services represented roughly 15 to 18 percent of total revenue. Today, Services account for approximately 26 percent, making it Apple’s second-largest segment and the primary driver of margin expansion and revenue stability. This growth reflects recurring monetization layered onto Apple’s installed base rather than incremental hardware units.
Over the same period, Mac, iPad, and Wearables, Home, and Accessories have remained important but relatively stable in absolute terms, while declining as a percentage of total revenue as Services scaled faster. This shift has improved the overall quality and resilience of Apple’s revenue base.
Crucially, this evolution is now well understood and embedded in analyst models. For Apple, valuation upside does not come from the existence of a growing Services business, but from whether Services continue to grow and expand margins faster than expected, while the iPhone franchise maintains its central role without meaningful erosion. The stock responds not to the mix itself, but to how that mix evolves relative to what the market has already priced in.
Step 3: Gross Margin and Pricing Dynamics
Gross margin is one of the clearest indicators of a company’s pricing power, cost discipline, and competitive positioning. Unlike revenue growth, margins reveal how much economic value a business retains as conditions change.
When reviewing gross margins, focus on three areas:
- Long-term margin trends, to understand whether pricing power and mix are structurally improving or deteriorating.
- Margin behavior during inflationary periods or demand slowdowns, which highlights cost control and competitive resilience.
- Consensus margin expectations versus reported results, since margins have a direct and leveraged impact on earnings.
Small changes in gross margin often translate into outsized earnings revisions, which is why markets tend to react quickly when margins deviate from expectations.
Case study example: Apple
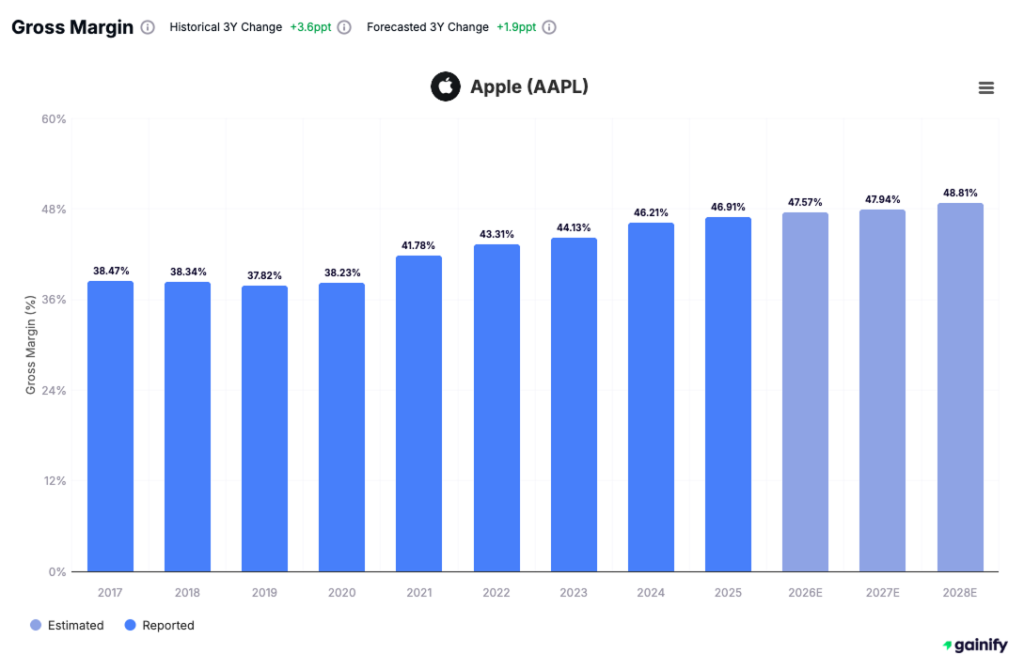
Apple’s gross margin profile has steadily improved over time, rising from the high-30 percent range several years ago to the mid-40s more recently. This expansion reflects a combination of favorable revenue mix, operational efficiency, and sustained pricing discipline. Importantly, consensus forecasts assume further incremental improvement, with margins expected to approach the high-40 percent range over the next several years.
Because these improvements are already reflected in expectations, Apple’s stock sensitivity is not driven by margin strength alone, but by whether reported margins confirm or challenge this projected trajectory. Even modest deviations versus consensus can materially affect earnings outlooks and, by extension, valuation.
Step 4: Operating Margin and Cost Execution
Operating margin measures how effectively a company converts revenue into operating profit after accounting for its full cost structure. While revenue shows demand, operating margin reflects management’s ability to control costs, allocate resources, and scale the business efficiently.
When assessing operating margins, focus on three areas:
- Historical margin stability, to understand how the business performs across cycles and periods of volatility.
- Consensus expectations for margin expansion or compression, since operating margins have a direct impact on earnings forecasts.
- Cost discipline during slower growth periods, which often distinguishes well-managed businesses from those reliant on revenue growth alone.
Markets tend to penalize operating margin compression more severely than revenue softness when expectations are elevated, because margin pressure signals execution risk and reduces earnings leverage.
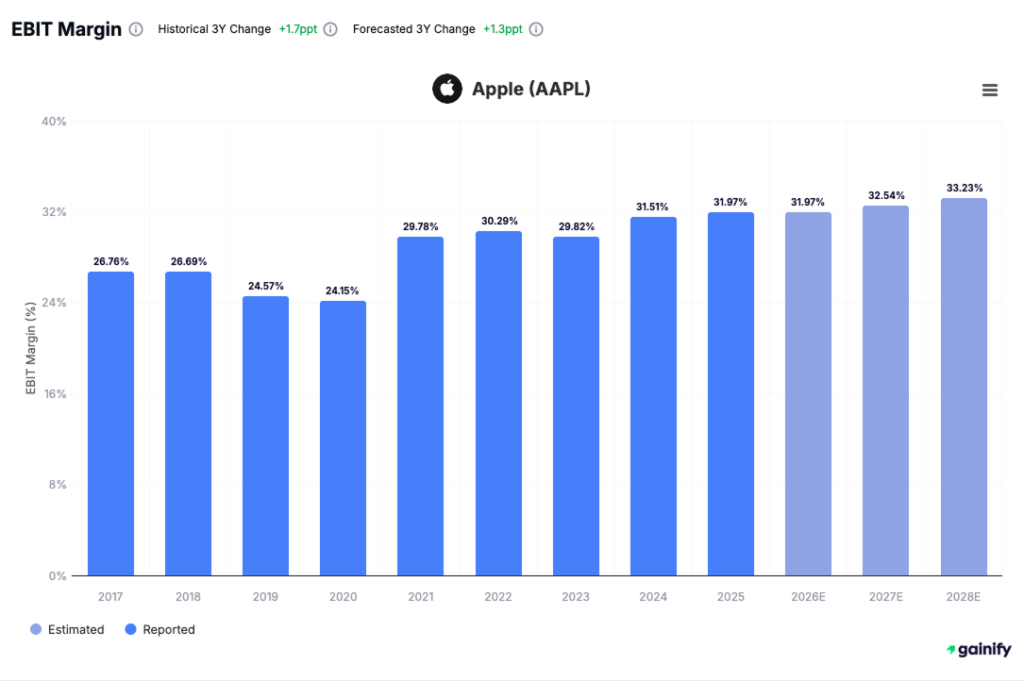
Case study example: Apple
Apple’s operating margins have shown a clear improvement over time, rising from the mid-20 percent range several years ago to the low-30 percent range more recently. This progression reflects a combination of scale benefits, disciplined operating expenses, and favorable revenue mix.
Importantly, consensus forecasts assume continued, incremental margin expansion over the coming years. As a result, Apple’s operating margins are closely monitored not because they are high, but because they are predictable. Deviations from this expected trajectory, even if modest, can materially affect earnings estimates and investor confidence.
Step 5: Operating Cash Flow and Earnings Quality
Operating cash flow is one of the most reliable indicators of earnings quality. While accounting earnings can be influenced by assumptions and timing, cash flow reflects the actual economic output of the business.
When evaluating operating cash flow, focus on three areas:
- Operating cash flow relative to net income, to assess the quality and sustainability of reported earnings.
- Forecasted cash flow growth versus historical performance, to understand whether expectations are realistic or aggressive.
- Cash flow behavior during periods of economic stress, which reveals business resilience and demand stability.
Markets pay close attention to cash flow because it directly funds reinvestment, dividends, and share repurchases. Consensus expectations for operating cash flow matter as much as reported results. When cash flow falls short of expectations, stocks often react negatively even if headline earnings appear acceptable.
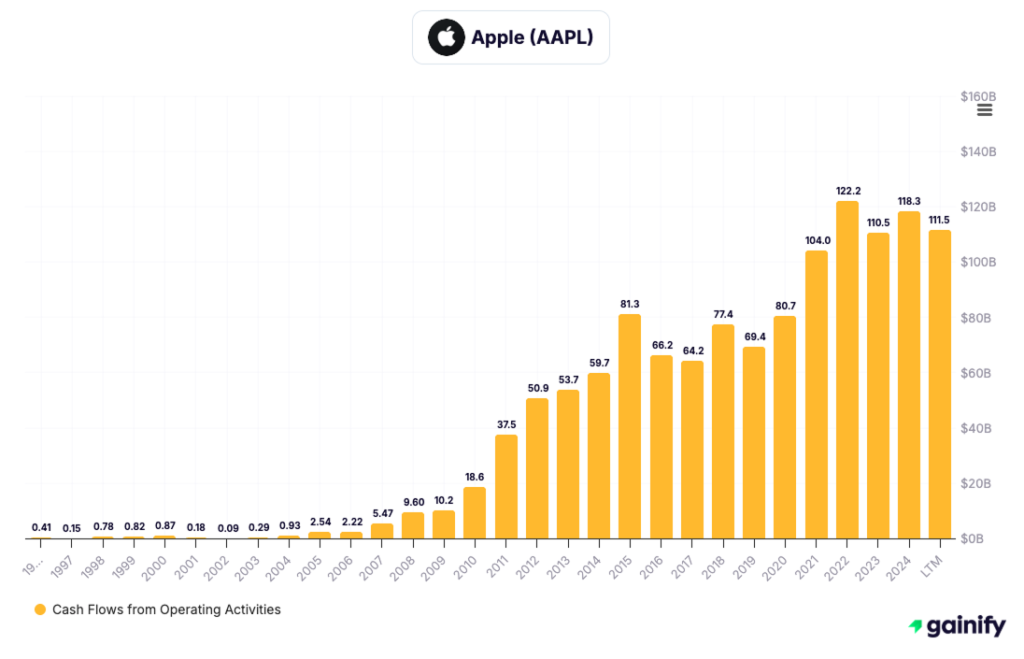
Case study example: Apple
Apple’s operating cash flow has grown steadily over time, scaling from relatively modest levels in earlier years to consistently exceeding $100 billion annually in recent periods. While year-to-year fluctuations reflect product cycles and working capital timing, the long-term trend demonstrates strong earnings quality and a high degree of cash generation.
Importantly, analyst models assume that Apple can sustain this level of operating cash flow over time. As a result, stock sensitivity is driven less by absolute cash generation and more by whether reported cash flow aligns with, exceeds, or falls short of those expectations.
Step 6: Net Income to Free Cash Flow Conversion
The ability to convert accounting earnings into free cash flow is a key indicator of business quality and durability. High conversion suggests efficient operations, disciplined capital spending, and earnings that are supported by real cash generation rather than accounting effects.
When evaluating conversion efficiency, focus on three areas:
- Historical free cash flow conversion rates, to assess how consistently net income translates into cash over time.
- Analyst assumptions for future capital expenditures, since changes in reinvestment needs directly affect free cash flow.
- The sustainability of cash generation, particularly whether cash flow remains resilient across cycles.
Free cash flow conversion is closely monitored because it underpins dividends, share repurchases, and balance sheet flexibility. Markets tend to react quickly when conversion weakens, as it raises questions about earnings quality and capital intensity.
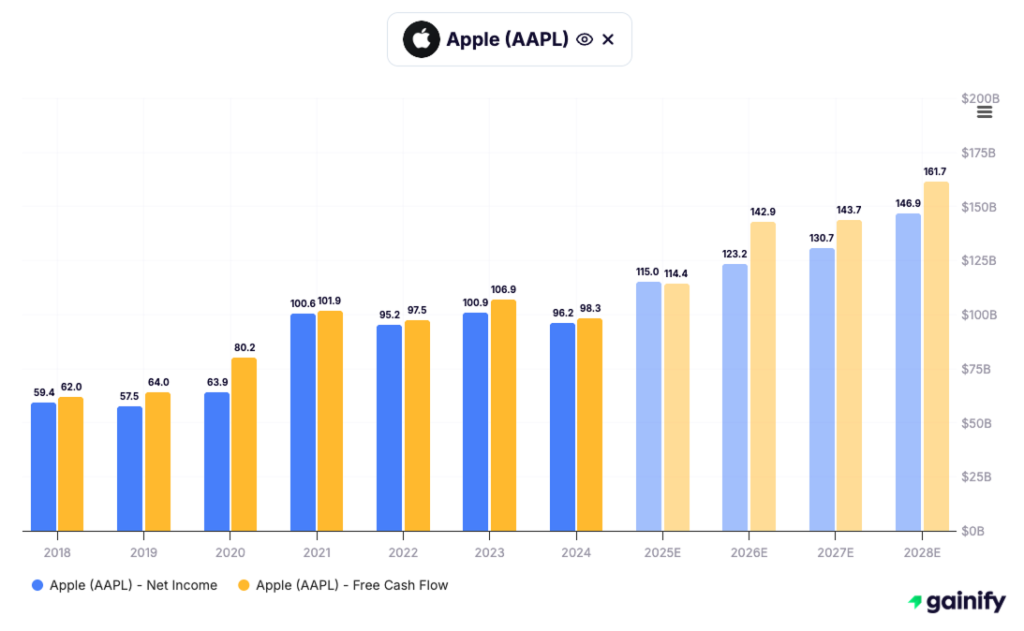
Case study example: Apple
Apple has historically converted a high proportion of net income into free cash flow, with free cash flow often matching or exceeding reported earnings. This reflects a capital-light operating model, disciplined capital expenditures, and strong working capital dynamics.
Consensus expectations assume that this high level of conversion remains intact. As a result, any sustained deterioration in free cash flow relative to net income would be viewed as structurally negative, as it would challenge long-standing assumptions embedded in valuation models and capital return forecasts.
Step 7: Balance Sheet Strength and Market Confidence
A balance sheet underpins a company’s ability to withstand shocks, invest through cycles, and maintain investor confidence. While it rarely drives upside directly, balance sheet risk can quickly become the dominant factor when conditions deteriorate.
When evaluating balance sheet strength, review metrics in the following order:
- Total debt and cash levels, to establish the absolute scale of financial obligations and available liquidity.
- Net debt or net cash position, which provides a clearer view of underlying leverage after liquidity is considered.
- Debt maturity profile, to assess refinancing risk and exposure to capital market conditions.
- Net debt to EBITDA, as a measure of leverage relative to operating earnings capacity.
- EBITDA to interest expense, to evaluate interest coverage and margin of safety.
- Analyst expectations for capital structure stability, since valuation and risk premia are built on assumed balance sheet behavior.
The market implicitly prices balance sheet safety. Unexpected changes in leverage, liquidity, or refinancing needs can quickly alter risk perception, even when operating performance remains stable.
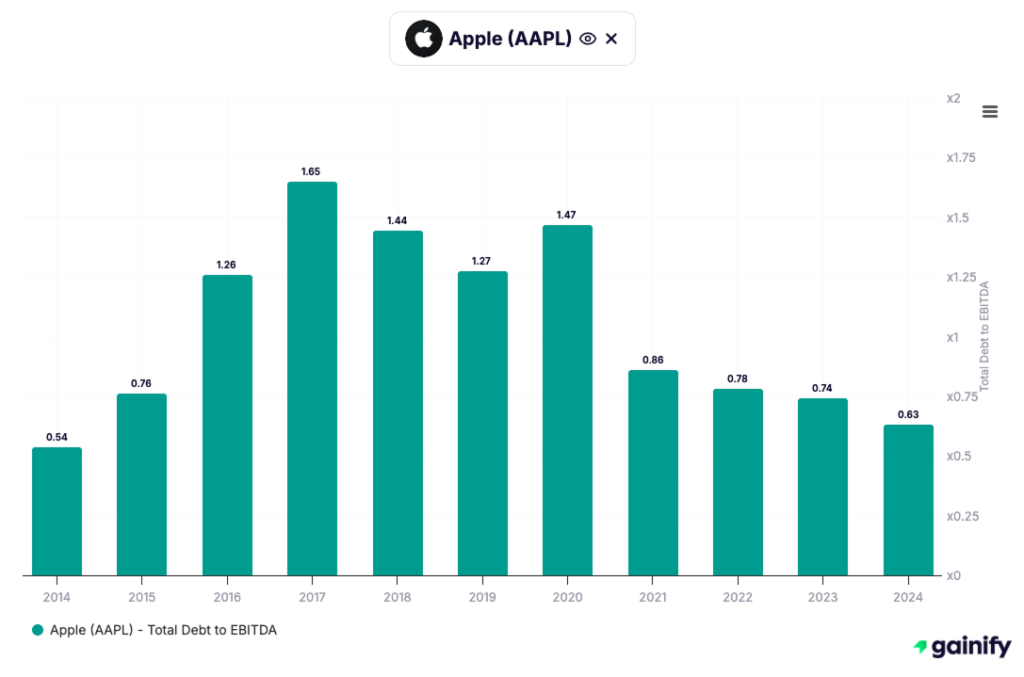
Case study example: Apple
Apple’s balance sheet is designed to emphasize stability and flexibility. Although the company carries a sizable amount of total debt, its cash position offsets a significant portion of this, resulting in modest net leverage. Debt maturities are well distributed, limiting refinancing risk, and leverage metrics such as net debt to EBITDA remain low. Interest coverage is strong, reflecting ample operating earnings relative to financing costs.
Consensus analyst models assume that this disciplined capital structure remains largely unchanged. As a result, balance sheet metrics are closely monitored not for stress, but for deviation from expectations, since any unexpected shift in leverage or coverage could quickly affect market confidence.
Step 8: Returns on Capital and Competitive Durability
Returns on capital are among the most reliable indicators of long-term business quality. Sustained high returns signal durable competitive advantages, efficient capital allocation, and pricing power. However, as with all metrics, returns only drive stock performance relative to expectations.
When assessing returns on capital, focus on the following:
- Historical ROIC and ROE trends, to determine whether high returns are sustained, improving, or eroding over time.
- Consensus expectations for return normalization, since markets often assume that unusually high returns will decline as competition intensifies.
- Underlying drivers of returns, including margin structure, asset intensity, and capital allocation decisions.
Valuation outcomes are often asymmetric in this area. If the market assumes returns will decline and they remain stable, valuation multiples can expand. If returns fall faster than expected, stocks can de-rate even when growth remains intact.
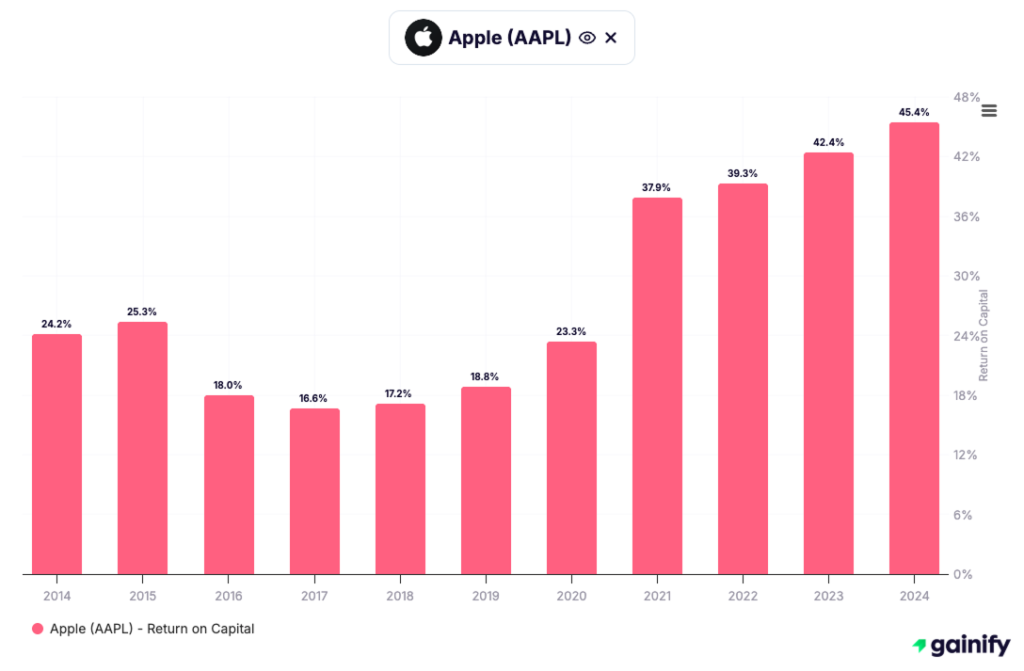
Case study example: Apple
Apple’s returns on capital have increased materially over the past decade, rising from the mid-teens to well above 40 percent in recent years. This reflects a combination of strong operating margins, a growing services mix, disciplined capital spending, and significant capital returns through buybacks.
Importantly, analyst models often assume some degree of return normalization over time as the business matures. Apple’s ability to sustain elevated returns has therefore been a key driver of valuation support. As long as returns remain structurally high, concerns about competitive erosion remain contained. Any sustained deviation from this profile, however, would prompt a reassessment of Apple’s competitive durability and long-term value creation.
Step 9: Valuation as a Reflection of Expectations
Valuation is not a judgment on whether a stock is expensive or cheap in absolute terms. It is a summary of the market’s expectations for growth, durability, and risk. Multiples expand and contract primarily when those expectations change.
When analyzing valuation, focus on the following tools in context:
- Forward price to earnings ratios, to understand how much investors are paying for expected future earnings.
- PEG ratios adjusted for expected growth, which help distinguish between justified and unjustified premiums.
- Free cash flow yield versus historical ranges, to assess valuation relative to the company’s own cash generation profile.
A stock rarely rerates without a clear shift in expectations. Strong fundamentals that merely confirm what is already priced in tend to result in stable, not rising, multiples.
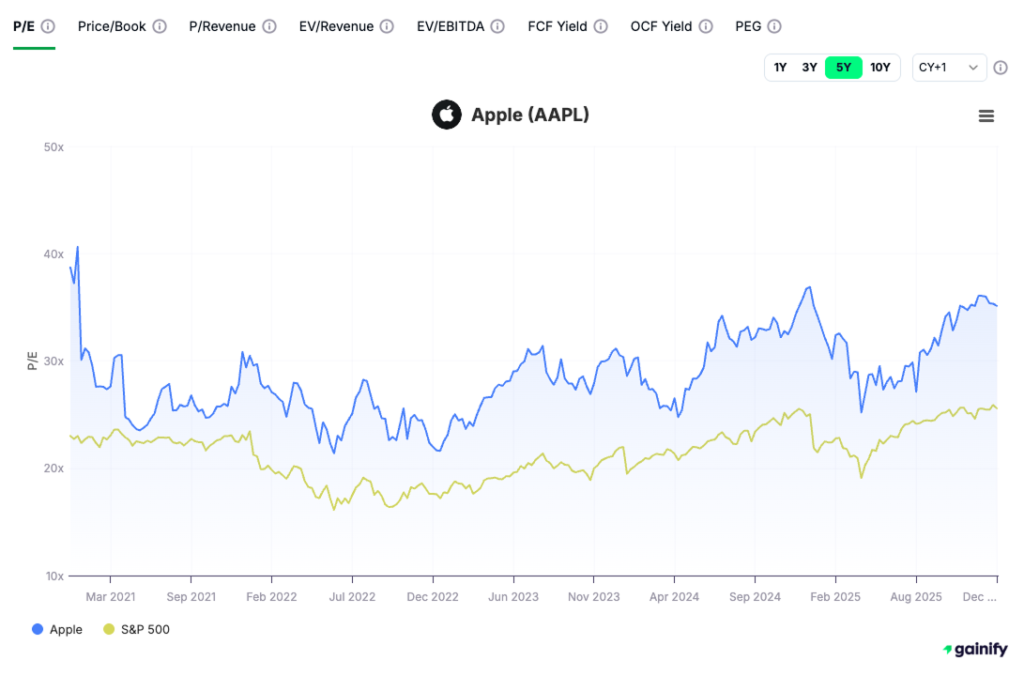
Case study example: Apple
Apple consistently trades at a premium to the broader market, reflecting its predictable cash flows, strong margins, and durable competitive position. This premium is not driven by high growth expectations, but by confidence in stability and execution.
As a result, valuation upside does not come from simply delivering solid results. Outperformance requires exceeding already high expectations, either through stronger-than-anticipated growth, margin expansion, or sustained capital returns. Conversely, even modest disappointments can lead to multiple compression when confidence is high.
Step 10: Narrative Discipline, When Story Meets Numbers
Narratives influence markets only when they are supported by measurable outcomes. Stories alone do not move stocks. Data that confirms or contradicts those stories does.
When evaluating a company’s narrative, focus on three questions:
- Does reported performance confirm or challenge analyst assumptions?
- Is management guidance conservative, realistic, or optimistic relative to consensus?
- Are current and planned investments aligned with returns the market expects to see?
When numbers and expectations align, stocks tend to trade steadily. When results meaningfully diverge from the prevailing narrative, stocks move, often quickly.
Case study example: Apple
In Apple’s case, the market narrative has recently centered on artificial intelligence and the company’s perceived pace of implementation relative to peers. While concerns around AI execution persist, Apple’s near-term financial performance remains far more sensitive to iPhone demand, services monetization, and margin delivery.
As a result, the stock’s behavior has been driven less by abstract positioning in AI and more by tangible outcomes such as iPhone sales trends, services growth, and margin stability. If AI investment begins to translate into clearer product differentiation and revenue impact, expectations may shift. Until then, execution in core businesses continues to matter more than narrative momentum.
Narrative discipline requires separating what is being discussed from what is being delivered. Sustainable stock performance emerges when long-term stories are eventually confirmed by short-term results.
Final Perspective: Reading Stocks Is the Study of Expectations
Great investors do not anchor on outcomes. They anchor on expectations.
They understand that every stock price reflects a collective forecast, and that returns are generated not by what happens, but by how reality compares to what was assumed. The core questions are always the same:
- What was the market expecting?
- What actually occurred?
- How will expectations change from here?
Every meaningful price move is the result of that sequence.
When you consistently integrate:
- Business quality, to understand long-term value creation
- Cash flow durability, to separate real earnings from accounting noise
- Capital discipline, to judge management decision-making
- Valuation realism, to ground expectations in price
- Expectation awareness, to anticipate market reaction
You stop reacting to volatility and start interpreting it.
That shift is not about being smarter or faster. It is about being more deliberate. Over time, this discipline compounds insight, reduces unforced errors, and allows capital to grow steadily in an environment where most participants are focused on the wrong signals.
Disclaimer
This material is provided solely for informational and educational purposes and is not intended as investment advice, a recommendation, or a solicitation to buy or sell any security. The discussion of companies, including Apple (Nasdaq: AAPL), is for illustrative purposes only and does not reflect a view on their future performance.
All analysis is based on publicly available information and general investment principles. Financial markets are inherently uncertain, and assumptions, expectations, and outcomes can change without notice. Past performance is not indicative of future results.
Investing involves risk, including the potential loss of capital. Readers should conduct their own independent analysis and consider seeking advice from a qualified financial professional before making any investment decisions.