
In the world of value investing, long-term success depends on finding undervalued stocks. These are companies whose stock prices trade below their intrinsic value based on strong financial fundamentals. What separates average investors from successful ones like Warren Buffett is the ability to identify these opportunities using time-tested financial metrics.
So, what are the key metrics used in value investing?
In short, mastering a set of core valuation ratios and indicators such as the price-to-earnings ratio, cash flow yield, and earnings growth empowers investors to make smarter, data-driven investment decisions. Whether you’re building a diversified portfolio or trying to avoid a bad investment, understanding these tools is essential for evaluating a stock’s future performance and financial health.
What Is Value Investing and How Does It Differ from Growth Investing?
Value investing is a disciplined strategy centered on buying undervalued stocks that are trading below their intrinsic value. This approach relies on analyzing a company’s financial statements, valuation metrics, and cash flow to identify opportunities that offer long-term capital growth with a built-in margin of safety.
In contrast, growth investing focuses on companies with strong earnings growth rates, future earnings potential, and expanding revenue streams, even if the current stock price appears high based on traditional valuation ratios.
🔑 Key Differences at a Glance:
- Value Investing
- Focuses on identifying undervalued securities relative to their intrinsic worth
- Prioritizes the relationship between market price and financial fundamentals
- Emphasizes a margin of safety to mitigate downside risk
- Common valuation metrics include: P/E ratio, P/B ratio, and dividend yields
- Typically favors companies with stable financial health and consistent historical earnings
- Growth Investing
- Seeks out high-growth companies with strong future performance potential
- Willing to pay a premium price per share based on future earnings expectations
- Focuses on forward-looking metrics, such as projected earnings growth and revenue expansion
- Key tools include the PEG ratio, analyst price targets, and long-term growth forecasts
- Appeals to investors with higher risk tolerance and a focus on capital appreciation
Both strategies aim to generate excess returns, but they differ in methodology, risk profiles, and time horizons. Whether you’re investing in dividend-paying stocks or chasing strong revenue growth, understanding these differences can help align your portfolio with your investment goals and risk tolerance.
7 Essential Value Investing Metrics for Identifying Undervalued Stocks
Value investing is a time-tested investment strategy focused on buying stocks that trade below their intrinsic value. The goal is simple but powerful: purchase high-quality companies at a discount and hold them long enough to realize their true worth. This strategy has been favored by some of the most successful investors in history, because it emphasizes strong fundamentals, financial discipline, and long-term returns.
Why pursue value investing?
Because it offers:
- A margin of safety through conservative valuation
- A focus on financial metrics rather than hype or momentum
- Better downside protection during market volatility
- Potential for excess returns when the market eventually re-rates the stock
- A strategy rooted in rational analysis, not speculation
To execute this strategy well, investors rely on a set of core metrics that reveal whether a company is undervalued, financially sound, and poised for future growth.
Below are the 7 most essential value investing metrics every investor should understand before making informed investment decisions.
1. Price-to-Earnings (P/E) Ratio
The P/E ratio is one of the most widely used valuation metrics. It compares a company’s current stock price to its earnings per share (EPS). A low P/E ratio may suggest that a stock is undervalued relative to its current earnings.
Formula: P/E Ratio = Market Price per Share / Earnings per Share (EPS)
Why It Matters: A lower earnings ratio compared to industry peers may indicate a buying opportunity, especially when supported by strong fundamentals and consistent earnings growth.
2. Price-to-Book (P/B) Ratio
The P/B ratio compares a stock’s market price to its book value. Book value represents the net asset value of a company according to its financial statements.
Formula: P/B Ratio = Market Price per Share / Book Value per Share
Why It Matters: A P/B ratio under 1.0 could signal undervalued securities, particularly in cyclical businesses or during extended periods of market distress.
3. Dividend Yield
Dividend yield measures the annual dividend payments relative to the stock’s price. It’s a key metric for dividend investors and income investors.
Formula: Dividend Yield = Annual Dividends per Share / Price per Share
Why It Matters: A high dividend yield might indicate a stable, cash flow-rich business with a healthy dividend payout ratio, but investors should also assess the company’s debt levels and future cash flows.
4. Free Cash Flow (FCF) Yield
Free Cash Flow Yield measures a company’s free cash flow relative to its current market capitalization. It offers insight into how efficiently a business generates cash in comparison to its stock price.
Formula: FCF Yield = Free Cash Flow / Market Capitalization
Why It Matters:
A higher FCF Yield may indicate that a company is undervalued and generating strong cash flow relative to its market price. It is a powerful valuation metric for assessing financial health, identifying undervalued stocks, and evaluating the potential for future returns, particularly during challenging periods or volatile market environments.
5. Return on Equity (ROE)
ROE measures a company’s efficiency in generating profits from shareholders’ equity.
Formula: ROE = Net Income / Shareholders’ Equity
Why It Matters: A consistently high ROE can reflect a strong business model and provide consideration for investors focused on long-term capital growth.
6. Debt-to-Equity (D/E) Ratio
The D/E ratio shows the level of a company’s financial risk by comparing total liabilities to shareholders’ equity.
Formula: Debt-to-Equity = Total Liabilities / Shareholders’ Equity
Why It Matters: Lower D/E ratios generally indicate more conservative measure of financial risk and suggest the company can weather challenging periods.
7. Earnings Growth
Earnings growth is a forward-looking metric that reflects how a company’s net income is increasing over time. It is essential for forecasting future earnings potential.
Why It Matters: Value investors seek companies with stable or accelerating growth indicators, especially if the stock is trading below historical averages or its intrinsic value, ensuring a margin of safety.
The Importance of Using Both Backward and Forward-Looking Metrics in Value Investing
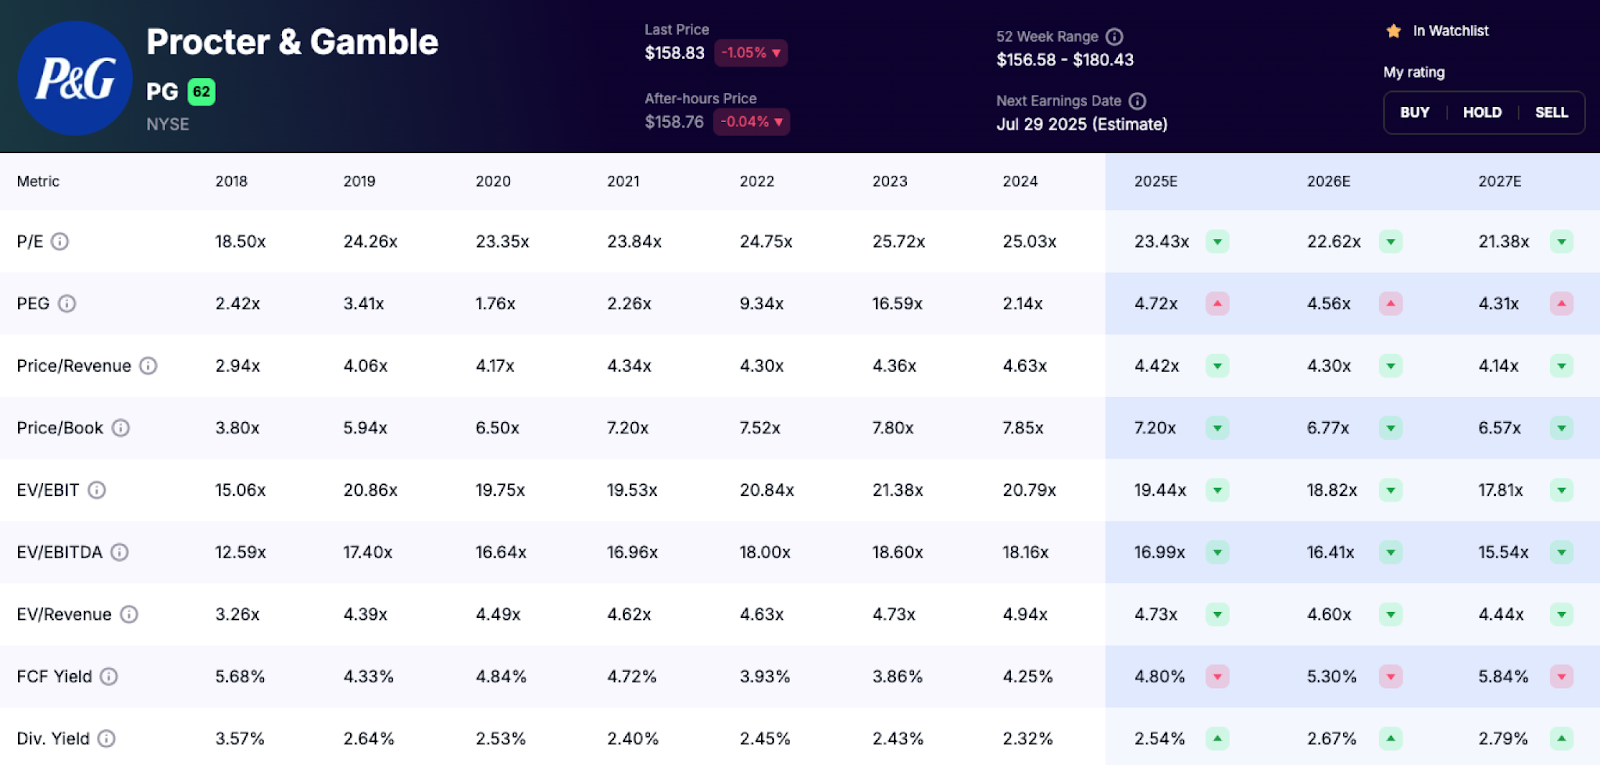
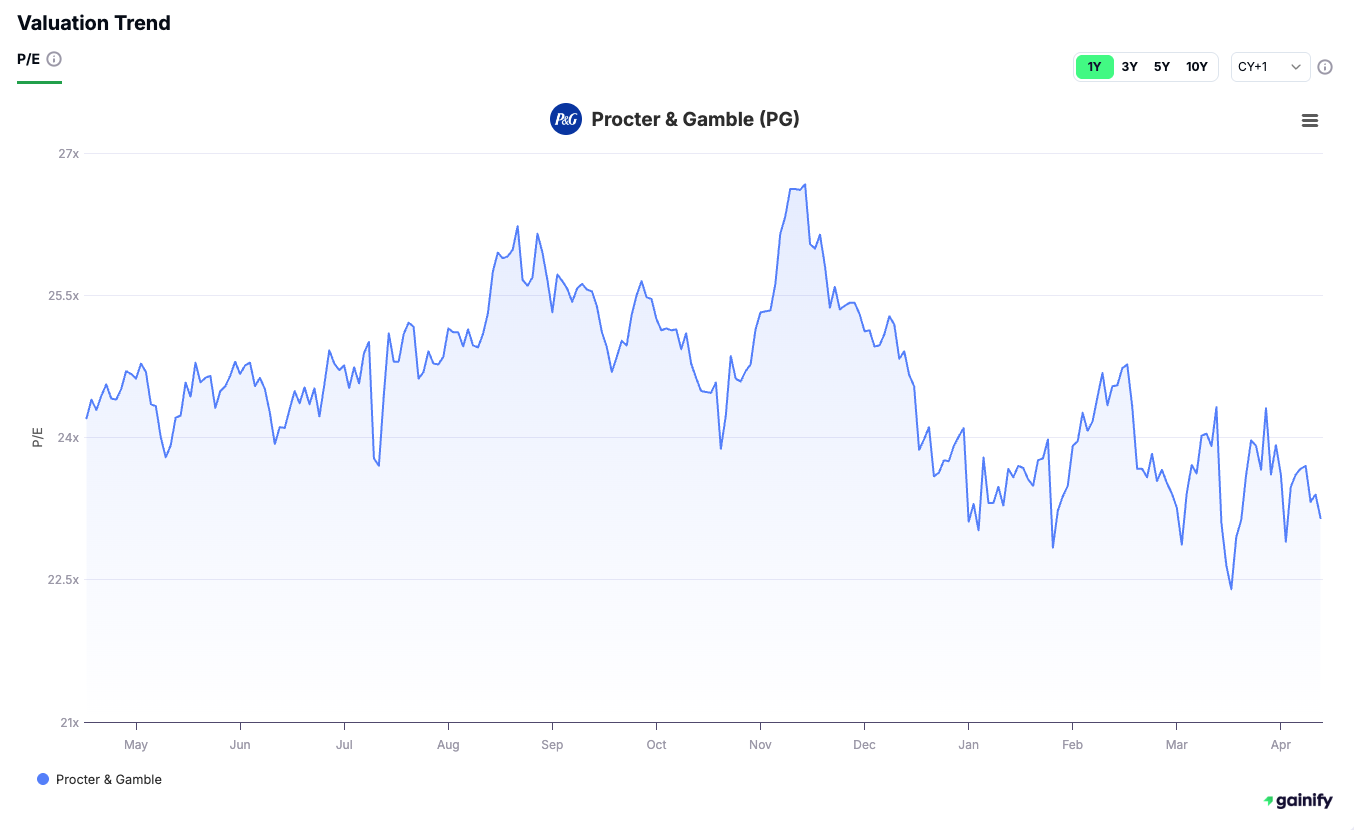
Value investing isn’t just about identifying low multiples. It’s about interpreting what those numbers actually mean – both in the context of past performance and future expectations. The 7 core metrics we discussed earlier (such as the P/E ratio, P/B ratio, FCF yield, dividend yield, ROE, D/E ratio, and earnings growth) can be applied from both a historical and forward-looking perspective.
Backward-Looking: Grounded in Reality
Backward-looking data is derived from a company’s audited financial statements and reflects actual, realized performance. For example:
- Trailing P/E and P/B ratios use historical earnings and book value.
- FCF yield based on previous 12-month cash flows offers a conservative valuation anchor.
- ROE and dividend yield show how efficiently capital has been used and returned.
These metrics provide a foundation of financial strength, helping investors understand how well a company has performed across different market cycles.
Forward-Looking: Pricing in Growth
On the other hand, forward-looking metrics use forecasts, analyst estimates, or management guidance. For example:
- Forward P/E anticipates future earnings.
- Projected ROE helps model capital efficiency.
- Estimated FCF yield captures expected cash generation power.
- PEG ratio bridges valuation with earnings growth projections.
These insights allow investors to assess whether a company’s growth potential justifies its current stock price, especially in sectors with evolving business models or disruptive trends.
Why You Should Use Both
A truly informed value investor looks at both sides:
- A company with strong historical performance but poor future guidance may face headwinds.
- A stock with strong projected growth but weak fundamentals may be overhyped.
- When both views align, the conviction level increases.
Key Takeaways
Value investing is a powerful strategy for building long-term wealth. By learning how to apply key financial metrics like the P/E ratio, FCF yield, ROE, and debt-to-equity, investors can identify high-quality businesses trading at attractive prices.
Using both backward-looking and forward-looking data allows for deeper insight into a company’s financial health, stability, and growth trajectory. This approach leads to more informed decisions and greater confidence in each investment.
Rather than chasing momentum or headlines, successful investors focus on what matters most: strong fundamentals, consistent earnings, and rational valuations.
With the right tools and discipline, you can spot undervalued stocks, reduce risk, and pursue lasting financial success.