

In the ever-changing world of the stock market, knowing how to find undervalued stocks in 2026 is more than a useful skill. It is a strategic advantage. Whether you’re building a long-term portfolio or identifying near-term opportunities, the ability to spot mispriced equities can be a key driver of returns.
At its core, uncovering undervalued stocks means identifying companies whose current share price does not reflect their intrinsic value. This value is based on projected earnings growth, a strong balance sheet, and operational efficiency. Often, these are high-quality businesses temporarily discounted due to market volatility, shifting sentiment, or underappreciated fundamentals.
This guide explains how to use fundamental analysis, interpret essential financial metrics, and benchmark companies against industry peers. From assessing earnings per share to analyzing valuation multiples, you’ll gain a step-by-step framework to find undervalued stocks and support each investment decision with clarity and confidence.
What Is an Undervalued Stock?
An undervalued stock is a publicly traded company whose current share price is trading below its estimated intrinsic value. That intrinsic value reflects forward-looking metrics such as future growth potential, healthy profit margins, strong cash flow, and overall financial health. The stock market can temporarily misprice such companies due to short-term headwinds, negative sentiment, earnings volatility, or macroeconomic shocks like market crashes.
These opportunities arise when the market focuses on recent setbacks rather than a company’s long-term fundamentals. Successful value investors capitalize on this dislocation.
As Benjamin Graham, the father of value investing, famously stated, “In the short run, the market is a voting machine; in the long run, it is a weighing machine.” Your responsibility as an investor is to make that long-term assessment with precision. This means carefully analyzing a company’s earnings power, assets, business model, and ability to deliver sustainable growth over time.
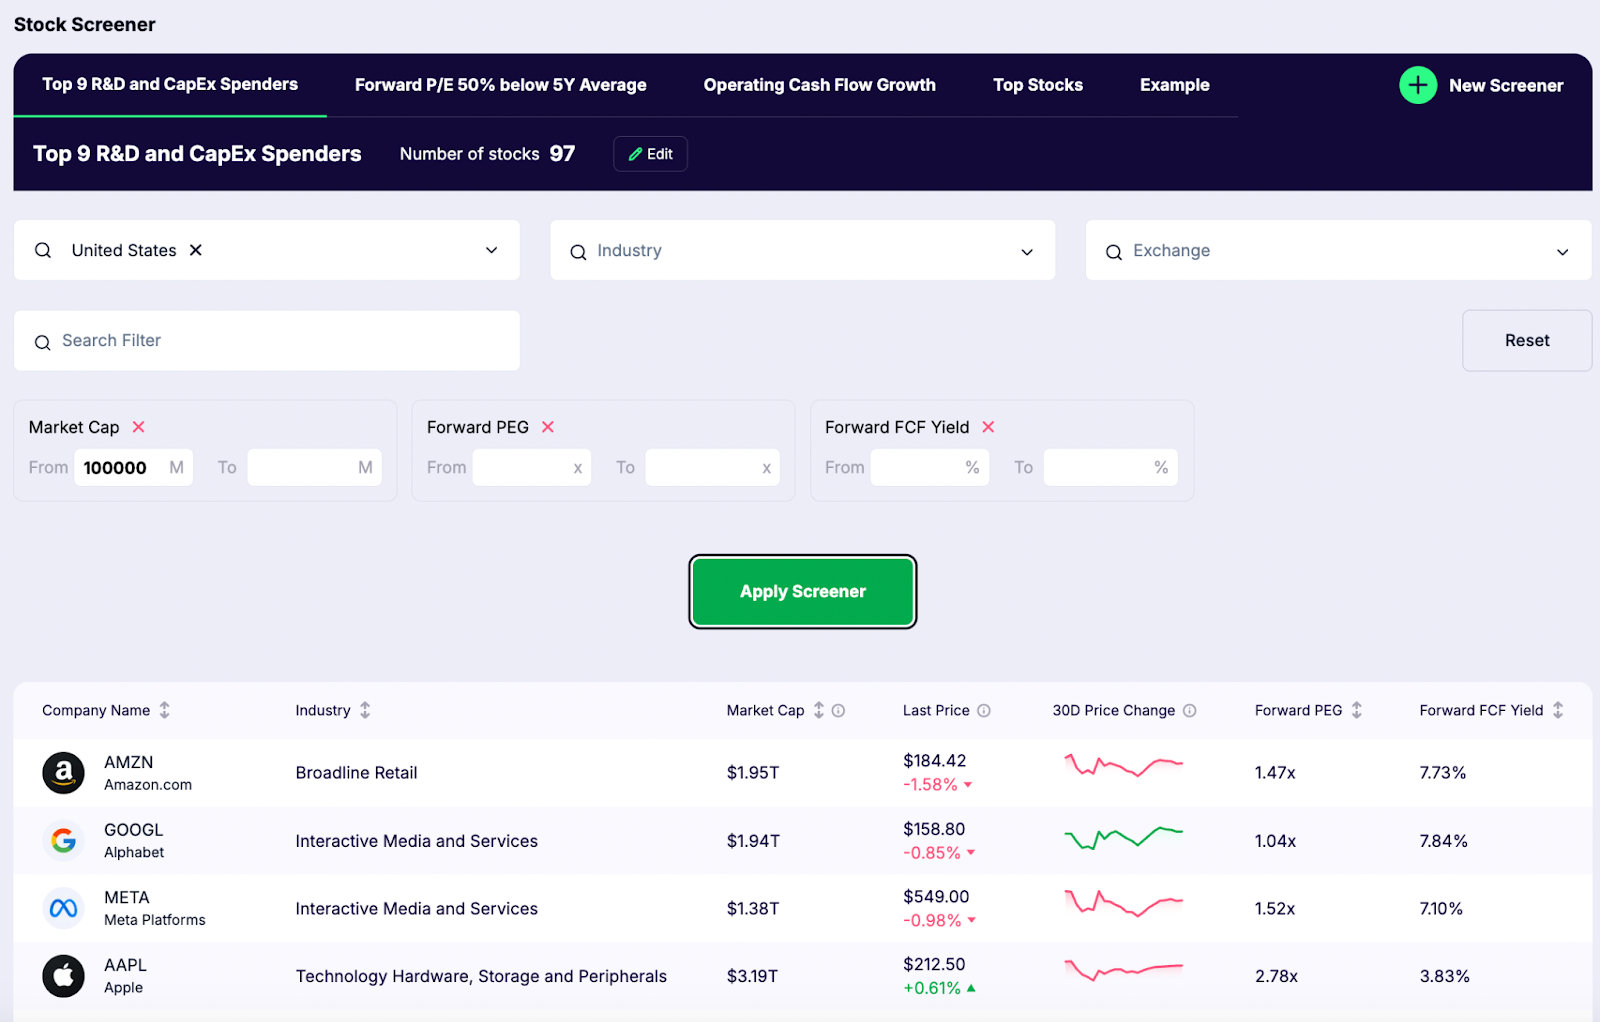
1. Start With a Stock Screener
The first step to finding undervalued stocks is using a stock screener, a tool that lets you quickly filter thousands of companies based on specific criteria. Stock screeners help narrow your search to only those companies that meet your investment goals.
To identify potentially undervalued companies, apply filters related to valuation, profitability, and financial strength. Look for:
- Low price-to-earnings (P/E) ratio – suggests the stock may be trading at a discount relative to its earnings
- High earnings yield – a sign that the stock is generating strong earnings relative to its price
- Low price-to-book (P/B) ratio – helpful for identifying asset-rich companies trading below book value
- Strong free cash flow yield – indicates efficient cash generation relative to market capitalization
- PEG ratio below 1.0 – shows that valuation may be low relative to expected growth
These filters will give you a shortlist of individual stocks that may be worth further research. From there, you can apply deeper fundamental analysis to determine if the stock is genuinely undervalued or if the low valuation reflects real risks.
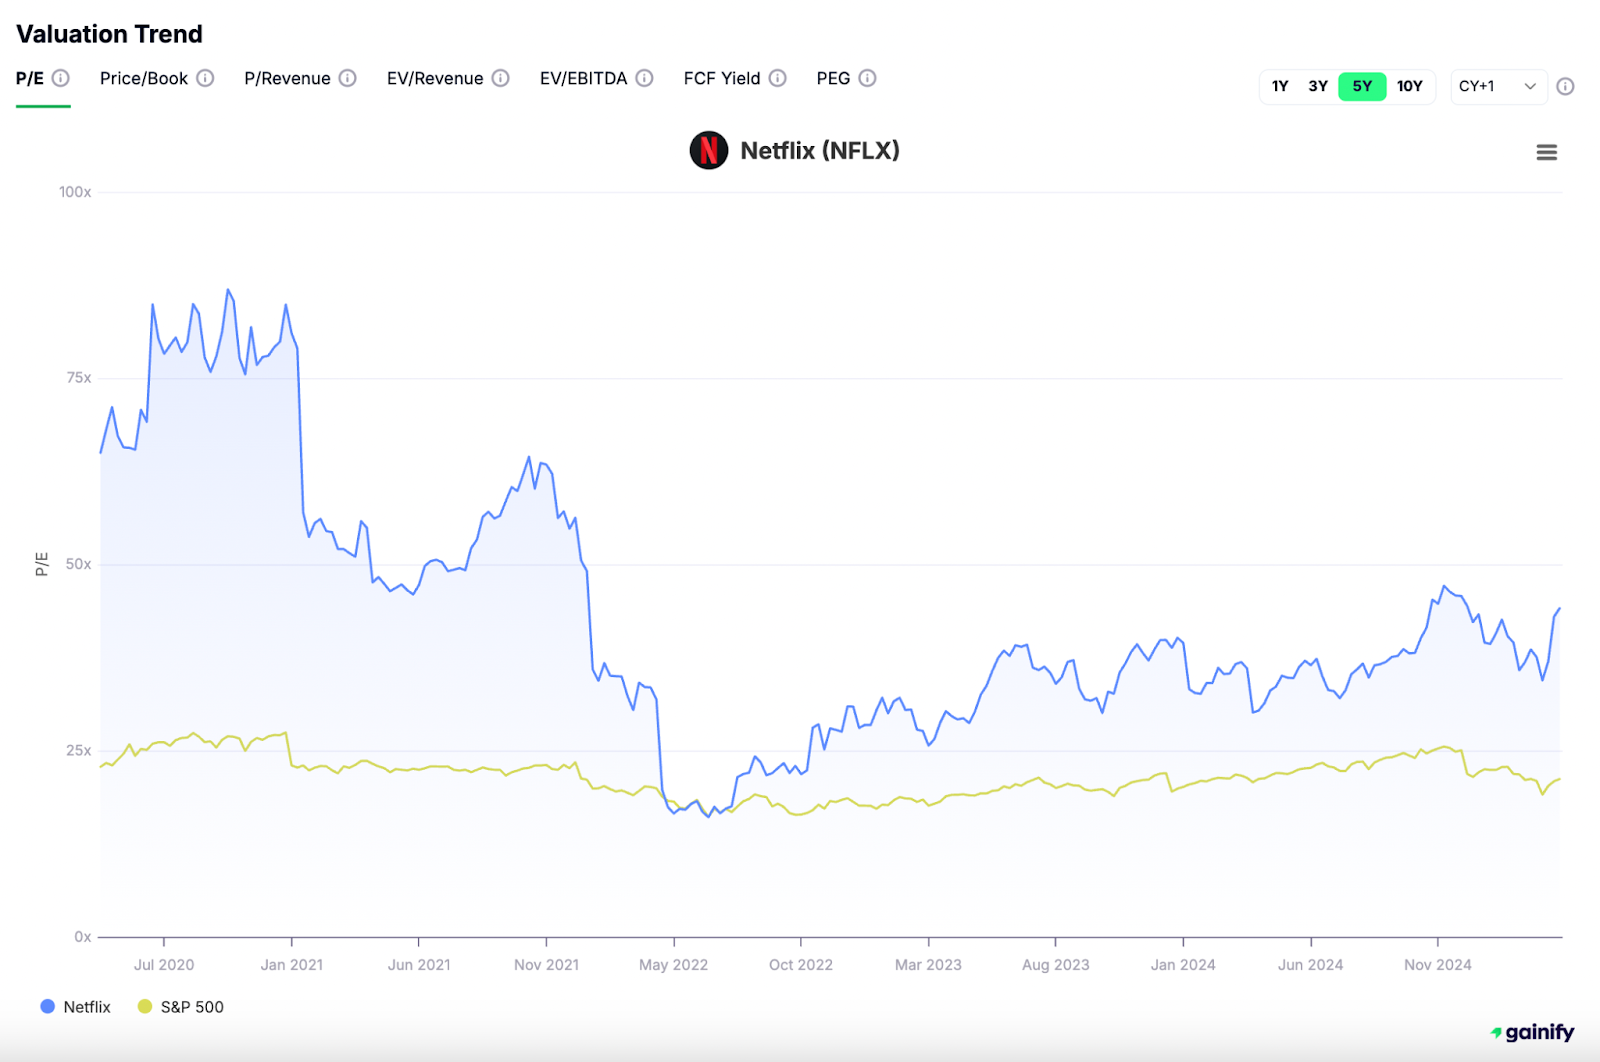
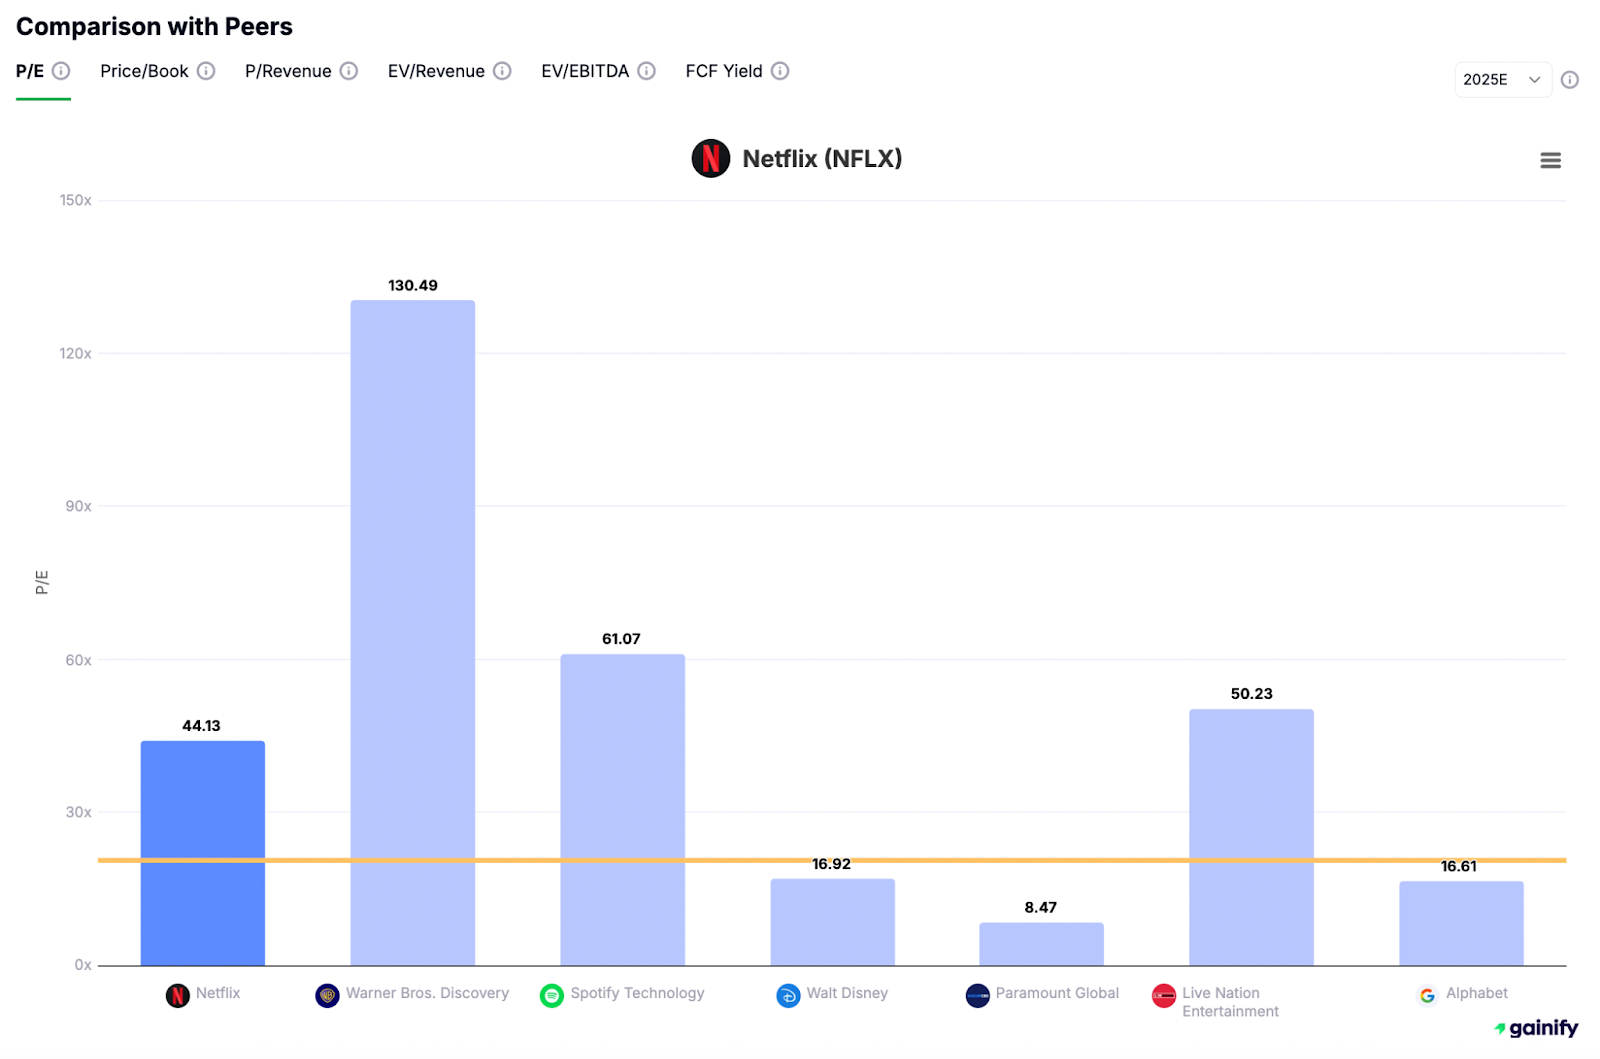
2. Analyze Valuation Metrics
🔹 Price-to-Earnings (P/E) Ratio
This earnings ratio compares the current share price to earnings per share (EPS). A lower P/E ratio relative to peers or historical averages may signal undervaluation. However, it should be assessed alongside growth rates, debt levels, and profit margins to avoid value traps.
🔹 Price-to-Book Ratio (P/B)
The P/B ratio compares a company’s market capitalization to its book value (assets minus liabilities). A P/B below 1.0 may suggest the stock is trading below its liquidation value. That said, this is more applicable to asset-heavy industries like financials or industrials and less so for tech companies with intangible assets.
🔹 Earnings Yield
Earnings Yield = EPS ÷ Share Price. This is the inverse of the P/E ratio and helps compare equity returns to bond yields or other asset classes. A high earnings yield indicates a company is producing strong profits relative to its price, often a useful signal for value investors.
🔹 Free Cash Flow Yield
Free Cash Flow ÷ Market Capitalization. This metric focuses on the company’s ability to generate actual cash, not just accounting profits. A high free cash flow yield suggests the stock is generating strong returns on valuation, making it attractive for investors focused on capital efficiency and downside protection.
🔹 EV/EBITDA Ratio
Enterprise Value ÷ EBITDA. This is a more capital-structure-neutral metric than P/E. It allows comparison across companies with varying levels of debt and preferred stock. A low EV/EBITDA, particularly in relation to industry averages, may highlight a truly undervalued stock, especially in capital-intensive sectors like manufacturing, telecom, or energy.
Together, these valuation tools offer a more complete picture of whether a stock is cheap relative to its earnings, cash flow, and enterprise value. Always compare metrics to the company’s own history, its sector peers, and the broader market before drawing firm conclusions.
3. Check Financial Health and Balance Sheet Strength
Analyzing a company’s balance sheet helps ensure it can survive downturns and reinvest in growth. Focus on:
✅ Current Ratio
Current Assets ÷ Current Liabilities. A current ratio above 1.5 suggests the company has strong short-term liquidity to manage its debt obligations and economic pressures. It’s a key indicator of operational stability and financial prudence.
✅ Quick Ratio
(Current Assets − Inventories) ÷ Current Liabilities. This more conservative measure excludes inventories, showing whether the company can meet immediate liabilities without selling inventory. A ratio above 1 reflects healthy liquidity under stricter assumptions.
✅ Equity Ratio
Shareholders’ Equity ÷ Total Assets. A high equity ratio signals low financial leverage and a conservative capital structure, which can help protect investors during periods of earnings volatility.
✅ Deb-to-Equity Ratio
Total Liabilities ÷ Shareholders’ Equity. This solvency ratio reflects the balance between debt and equity financing. A lower ratio often indicates a more sustainable level of debt and lower financial risk.
Also review preferred stock levels and outstanding shares, as these impact ownership dilution, dividend obligations, and valuation accuracy.
4. Assess Profitability and Return Efficiency
Not every low-priced stock is worth buying. You must confirm that the business is not only generating earnings, but doing so efficiently. This means understanding how well the company converts revenue into profit and whether its returns justify the capital employed.
🔹 Return on Equity (ROE)
Net Income ÷ Shareholders’ Equity. A consistently high ROE indicates effective use of shareholders’ funds and strong profit generation. Be cautious of unsustainably high ROEs driven by excessive leverage.
🔹 Return on Capital (ROIC)
NOPAT ÷ Invested Capital. This metric captures how well a company turns all forms of capital — both debt and equity — into profits. A ROIC above the company’s cost of capital signals value creation and efficient capital deployment. It’s also one of the best tools for comparing business quality across competitor companies.
🔹 Gross Profit and Other Margins
Gross Profit ÷ Revenue. Strong and stable gross margins suggest durable pricing power and tight cost control. Also examine operating margins and net margins for a fuller view of overall profitability.
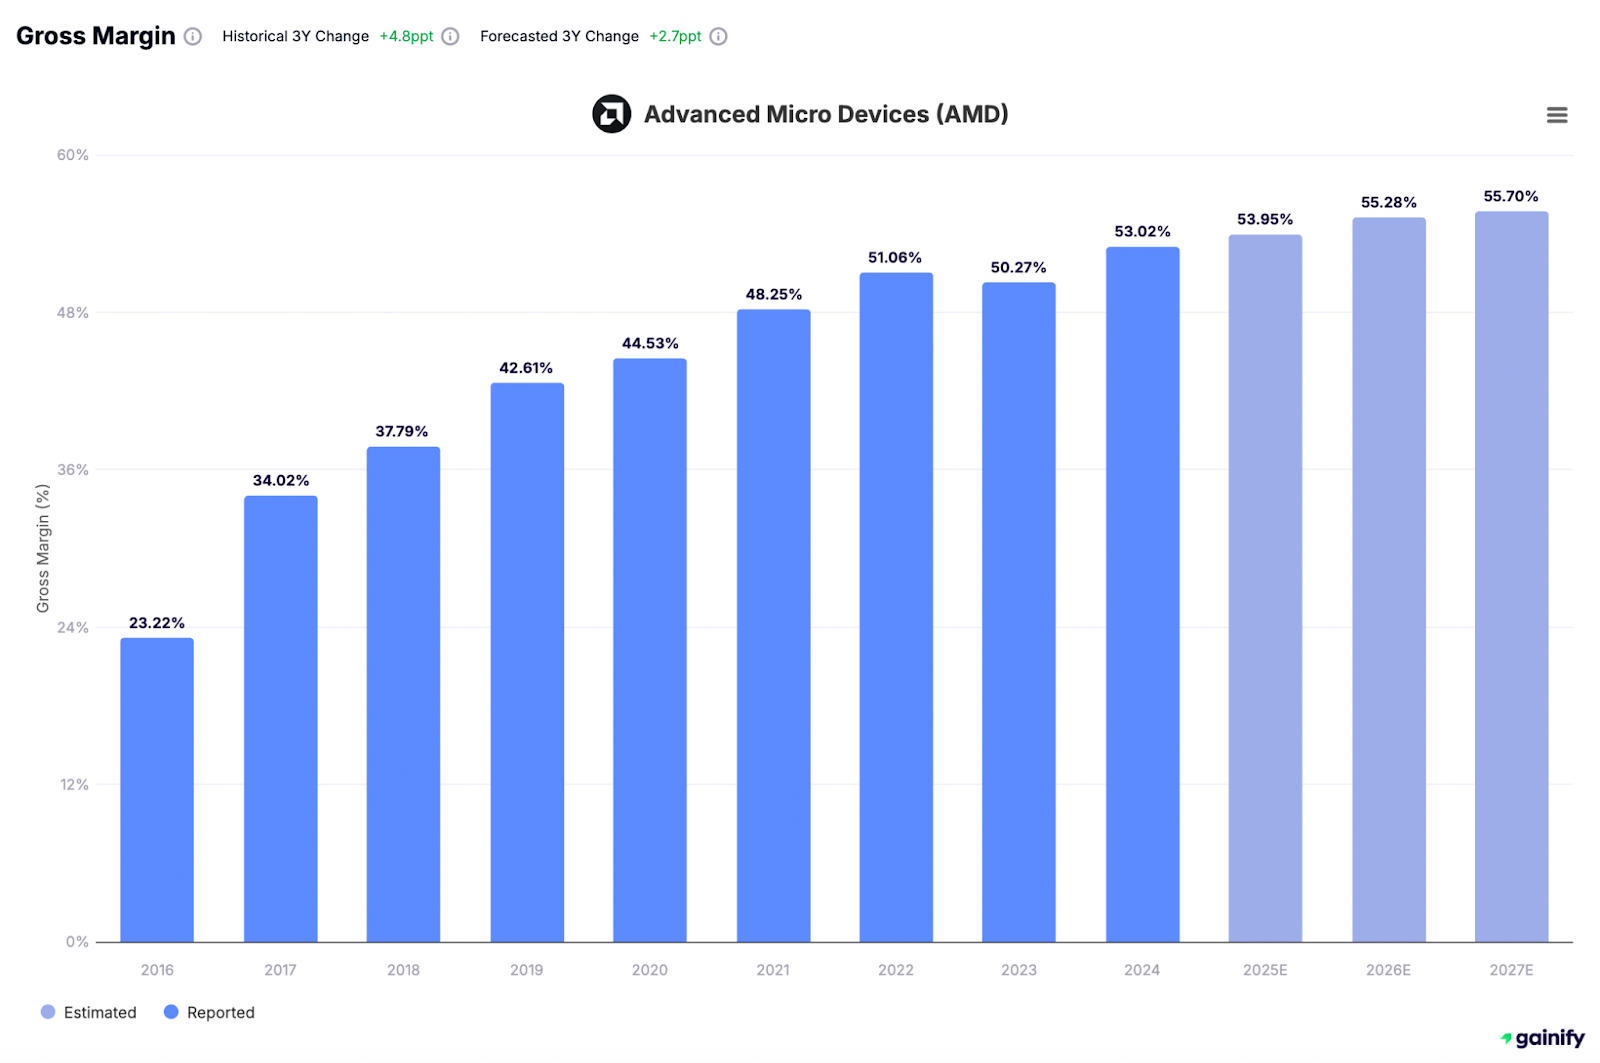
Companies with high, consistent margins and solid return metrics tend to have sustainable business models, competitive advantages, and superior long-term earnings potential. These signals are essential for distinguishing between temporarily cheap stocks and truly undervalued, high-quality companies.
5. Evaluate Growth Potential and Market Dynamics
A stock’s current valuation is only one piece of the puzzle. Long-term investors must also assess whether the company has a clear path to future growth and can capitalize on market dynamics to expand profits and shareholder value.
Look at:
- Historical revenue growth rate and earnings growth rate over the past 3 to 5 years.
- Signs of margin expansion, especially if driven by operational efficiency rather than short-term cost cuts.
- Investment in new product development, R&D, or entry into adjacent or international markets.
- Analyst consensus estimates and target prices, while not perfect, can provide insights into sentiment and growth expectations.
Crucially, compare a company’s growth trajectory with industry peers and competitor companies. Even modest, steady growth can be highly attractive when it’s underappreciated by the market, especially if the stock trades at a discount relative to its fundamentals.
Be cautious of companies with erratic growth, unclear reinvestment plans, or aggressive projections unsupported by execution history. Growth is valuable only when it’s repeatable, strategic, and aligned with shareholder interests.
6. Estimate Intrinsic Value vs. Market Price
To determine if a stock is truly undervalued, you must estimate what the business is fundamentally worth and compare that to its current stock price.
- Discounted Cash Flow (DCF): Projects a company’s future cash flows and discounts them back to present value using a risk-adjusted discount rate. This method is ideal for mature businesses with predictable cash flows.
- Dividend Discount Model (DDM): Suitable for stable, dividend-paying companies. This method values a stock based on expected dividend payments, assuming a constant growth rate.
- Sum-of-the-Parts Analysis: Best for diversified or conglomerate businesses. It assigns value to each business segment individually and adds them together to estimate total intrinsic value.
If your analysis indicates that intrinsic value exceeds the current market price by 20–30% or more — and the business fundamentals are sound — the stock may represent an attractive investment opportunity.
7. Qualitative Checks: Leadership, Strategy, and Market Fit
Finally, remember that numbers tell only part of the story. Qualitative factors can reinforce or invalidate a stock’s attractiveness.
- Leadership track record – Do executives have a history of prudent capital allocation and consistent execution?
- Corporate governance – Are shareholder interests protected through transparency, board oversight, and sensible compensation practices?
- Strategic focus – Is the company investing behind a clear, long-term growth strategy, or reacting impulsively to market noise?
- Business model resilience – Does the company operate in a structurally attractive market, and can it adapt to evolving competition or technology?
Even a seemingly cheap stock can underperform if management lacks discipline or the company is structurally misaligned with industry trends. Use these qualitative checks as a sanity filter before making your final investment decision.
8. Common Pitfalls to Avoid
Even the most well-researched stock analysis can go astray without discipline. Watch out for these frequent mistakes:
✅ Don’t rely on a single valuation ratio – Always cross-check across multiple financial metrics and interpret within industry context.
✅ Be cautious of value traps – Stocks with falling sales, eroding margins, or excessive debt can appear cheap but may decline further.
✅ Ignore one-time gains – Avoid overestimating earnings inflated by asset sales, tax credits, or other non-recurring items.
✅ Account for dilution – Monitor share count and stock-based compensation, which can quietly erode per-share value.
✅ Benchmark broadly – Always compare against sector peers, the company’s historical performance, and the broader market to assess whether a stock is truly undervalued.
In short, no single data point tells the full story. A balanced, multifaceted approach is essential to making sound investment decisions.
Final Thoughts: What Makes a Stock Truly Undervalued?
Finding undervalued stocks is not about chasing the cheapest names. It is about identifying quality companies temporarily trading below their true worth. It requires patience, discipline, and a willingness to think independently of market sentiment.
By combining rigorous fundamental analysis with a clear understanding of valuation, profitability, balance sheet strength, and long-term strategy, investors can unlock superior opportunities hidden in plain sight.
Use every tool available, from stock screeners and DCF models to return metrics and management evaluations, to build a full picture of the company behind the ticker.
Remember: markets may stay irrational for stretches of time, but eventually, fundamentals win. Stay consistent, remain curious, and let the data, not the noise, guide your decisions.
When approached with the right mindset and framework, learning how to find undervalued stocks becomes more than an exercise in numbers. It becomes a path to compounding capital, building conviction, and mastering the art of long-term investing.
Disclaimer: This article is for informational and educational purposes only and does not constitute financial advice. Always consult with a qualified financial advisor before making investment decisions.