

The US Property and Casualty insurance sector enters 2026 from a position of unusual strength. After several years of elevated loss costs, firm pricing and rising interest income, the industry now faces a new phase as interest rates begin to move lower. Yet the expected pressures from easing monetary policy are proving much softer than many anticipated.
Investment portfolios remain supported by yields locked in during the tightening cycle, underwriting margins are healthy and capital positions are robust across the leading carriers.
The sector’s core advantage remains unchanged. Unlike many industries, P&C insurers reset pricing annually, allowing them to adjust quickly to inflation, loss trends and competitive dynamics.
As the broader economy stabilizes, exposure growth is improving, personal auto results have normalized and commercial pricing remains disciplined even as competition increases.
The companies that combine underwriting consistency, analytical strength and balanced portfolio construction are positioned to outperform into 2026.
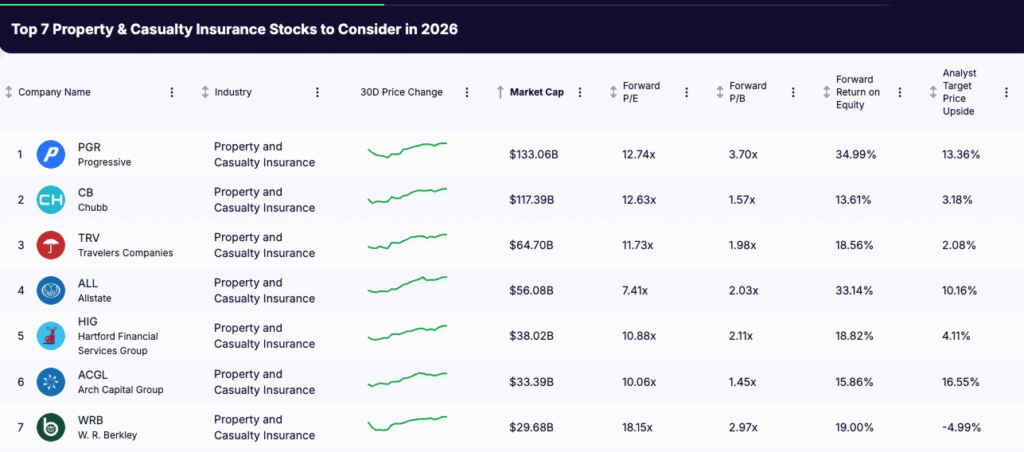
Below are the top seven US P&C insurance stocks best placed to navigate this environment according to current financials, operational positioning and forward earnings power.
Key Points
• US P&C insurers enter 2026 with strong capital, stable pricing and solid underwriting profitability
• Rate cuts have begun but investment income remains supported due to duration extension
• Leading carriers benefit from disciplined pricing, recurring repricing and diversified underwriting
What Is P&C Insurance (Also Called Non-Life Insurance)?
Property and Casualty insurance, also known as non-life insurance, is the part of the insurance sector that protects individuals and businesses against financial losses from property damage, accidents, liability, and unexpected events. These policies do not involve mortality or longevity risk, which is why they are called non-life insurance outside the US.
In the United States, the term Property and Casualty insurance is used almost universally, but it refers to the same product set as non-life insurance. These policies typically renew once per year, allowing insurers to reprice frequently in response to inflation, loss trends and shifts in risk conditions. This annual repricing is one of the reasons P&C insurers maintain more stable earnings compared to other financial sectors.
Key Types of P&C (Non-Life) Insurance
Category | Key Line | What It Covers |
Personal Lines | Auto Insurance | Liability and physical damage for personal vehicles |
Homeowners Insurance | Property damage and liability for primary residences | |
Personal Umbrella | Additional liability coverage above auto and home | |
Commercial Lines | Commercial Property | Buildings, equipment and business interruption |
General Liability | Third-party bodily injury and property damage | |
Workers Compensation | Medical costs and lost wages for workplace injuries | |
Commercial Auto | Vehicles owned or operated by businesses | |
Commercial Umbrella / Excess | Additional liability limits above primary coverage | |
Specialty Lines | Cyber Insurance | Data breaches, ransomware, and privacy liability |
Directors & Officers (D&O) | Claims against corporate leadership | |
Reinsurance | Risk transfer between insurers | |
Catastrophe Property | Losses from hurricanes, wildfires and severe weather |
Top 7 US Property and Casualty Insurance Stocks for 2026
The companies below represent the strongest positioning in the US P&C sector heading into 2026. Each has demonstrated consistent underwriting execution, disciplined pricing, resilient capital strength and the ability to navigate shifting rate conditions. Together, these carriers offer a clear view of where profitability, exposure growth and competitive advantage are most concentrated in the non-life insurance market.
To filter similar stocks, open the Gainify stock screener and select ‘Property and Casualty Insurance’ from the Industry filter.
1. Progressive (NYSE: PGR)
Market cap 133.06B
Forward P/E 12.74x
Forward ROE 34.99 percent
Analyst Forecasted Upside 13.36 percent
Overview
Progressive is the dominant operator in US personal lines and the sector’s most consistently performant underwriting franchise. The company’s advantage centers on scale in telematics, granular risk segmentation and a rapid rate-adjustment cycle that allows it to price faster and more accurately than peers. These capabilities supported another strong quarter in Q3 2025, with disciplined execution across auto, property and commercial lines and a balance sheet that remains one of the strongest in the industry.
Recent Developments (Q3 2025)
Progressive’s Q3 results underscored the resilience of its model.
- Net premiums earned grew 14 percent to $20.8 billion, supported by both rate momentum and retention across personal lines.
- Investment income increased 25 percent to $924 million, benefiting from higher book yields secured during the tightening cycle.
- Net income reached $2.6 billion, while shareholders’ equity rose to $35.4 billion, reflecting consistent profitability and AOCI improvement.
Investment Thesis
Progressive’s operating model continues to compound its competitive lead. The company’s real-time pricing feedback loop and advanced segmentation keep underwriting margins stable even as the broader market absorbs volatility. With double-digit premium growth, strong investment income support and expanding capital, Progressive carries one of the clearest visibility profiles into 2026. Its ability to protect margin while growing share remains unmatched in US personal lines.
Key Risks
Auto repair and parts inflation remain the primary margin variables. Competitive intensity across personal auto is increasing as carriers regain profitability, which may pressure pricing. A more rapid decline in interest rates could modestly weigh on investment income, though PGR’s locked-in yields provide near-term stability.
2. Chubb (NYSE: CB)
Market cap 117.39B
Forward P/E 12.63x
Forward ROE 13.61 percent
Analyst Forecasted Upside 3.18 percent
Overview
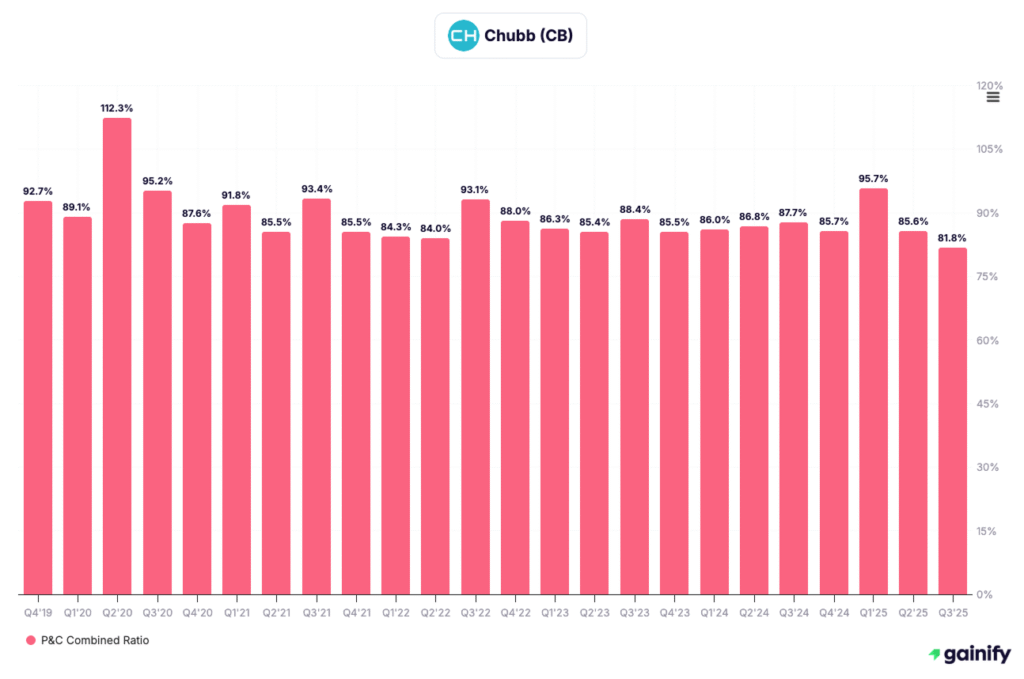
Chubb is one of the largest and most diversified global P&C insurers, with meaningful scale in commercial, personal, and specialty lines across North America and international markets. The franchise is built around conservative risk selection, deep expertise in large-account commercial business, and a consistently strong balance sheet. In Q3 2025 the company again delivered top-tier underwriting results, with solid premium growth, lower catastrophe losses, and rising investment income reinforcing its status as a core compounder in the sector.
Recent Developments (Q3 2025)
Chubb’s Q3 2025 performance highlighted the strength of its multi-line model.
- Net premiums written increased to about 14.9 billion dollars, up roughly 7 percent year over year, with growth across commercial and consumer businesses.
- P&C underwriting remained very profitable, supported by lower catastrophe loss and favorable prior-year reserve development, keeping the combined ratio firmly in the low-80s.
- Net investment income rose to roughly 1.65 billion dollars, and net income and shareholders’ equity both increased, with equity reaching around 72 billion dollars on improved earnings and bond market marks.
Investment Thesis
Chubb offers institutional investors a rare mix of scale, underwriting discipline, and global diversification. Its book of predominantly commercial and specialty risks generates attractive risk-adjusted margins, while the large high-quality fixed-income portfolio provides meaningful earnings leverage to still-elevated long-term yields. The company has a long record of rational capital allocation, combining steady dividend growth with sizable share repurchases without compromising capital strength. With rate adequacy still solid in key lines, rising investment income, and incremental growth from international expansion, Chubb remains one of the cleaner long-duration P&C compounders into 2026.
Key Risks
Chubb is exposed to volatility from large natural catastrophe events and to social inflation in long-tail casualty and financial lines, which can drive reserve noise. Integration and execution risk exists around its expanding Asian footprint. A faster-than-expected compression in long-term rates would temper the tailwind from investment income, although the underlying underwriting engine remains robust.
3. Travelers (NYSE: TRV)
Market cap 64.70B
Forward P/E 11.73x
Forward ROE 18.56 percent
Analyst Forecasted Upside 2.08 percent
Overview
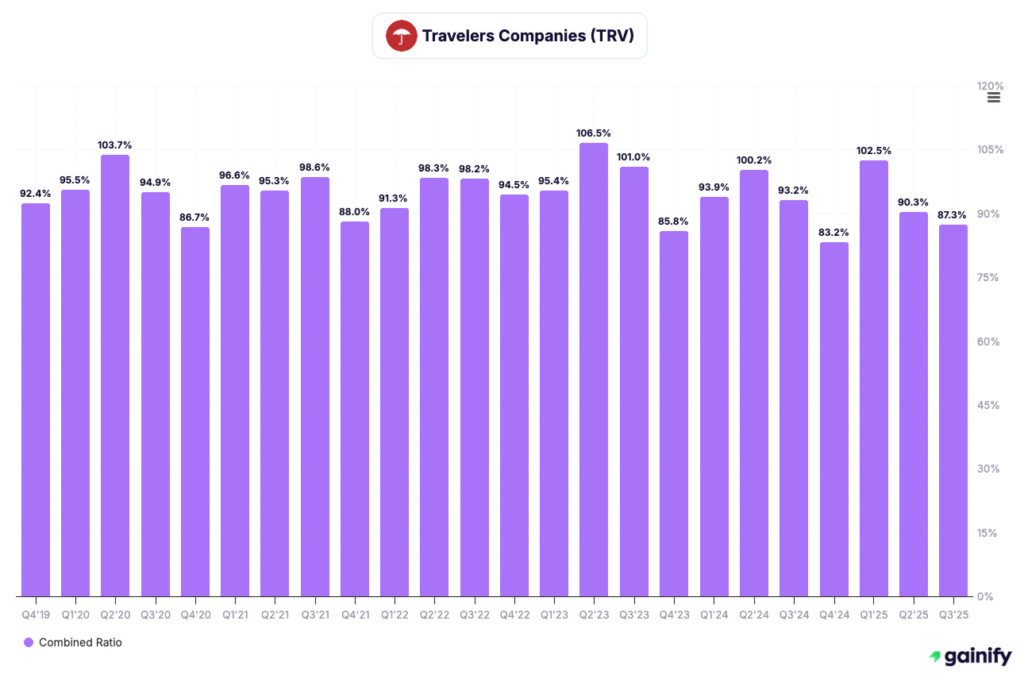
Travelers is one of the most consistently disciplined commercial P&C insurers in the United States, known for underwriting rigor, conservative reserving and a highly stable multi-line portfolio. The company’s mix across Business Insurance, Bond & Specialty and Personal lines gives it a balanced earnings profile, while its high-quality investment book provides dependable income. In Q3 2025 the franchise again delivered one of the strongest performances in the sector, with improved margins, lower catastrophe losses and continued growth in investment income.
Recent Developments (Q3 2025)
Travelers’ Q3 results reaffirmed the strength of its operating model.
- Core income increased 53 percent to 1.87 billion dollars, driven by improved underwriting and rising investment income.
- The combined ratio improved to 87.3 percent, supported by an underlying combined ratio of 83.9 percent and sharply lower catastrophe losses of 402 million dollars compared with 939 million dollars a year earlier.
- Net investment income rose 15 percent to 850 million dollars, reflecting higher yields across a predominantly investment-grade portfolio.
Investment Thesis
Travelers offers one of the clearest expressions of high-quality, low-volatility P&C earnings. The company’s underwriting framework prioritizes margin consistency over top-line expansion, resulting in durable profitability through cycles. With catastrophe loads normalizing, rate adequacy still supportive in commercial lines and investment income benefiting from higher reinvestment yields, Travelers enters 2026 with improving earnings visibility. The balance sheet remains a competitive advantage, enabling continued buybacks and dividend growth without compromising capital strength.
Key Risks
Travelers remains exposed to catastrophe variability and competitive pressure in commercial pricing. Long-tail casualty trends, including social inflation, present reserve uncertainty. A faster decline in interest rates would moderate forward investment income, though the portfolio’s conservative duration profile provides some insulation.
4. Allstate (NYSE: ALL)
Market cap 56.08B
Forward P/E 7.41x
Forward ROE 33.14 percent
Analyst Forecasted Upside: 10.16 percent
Overview
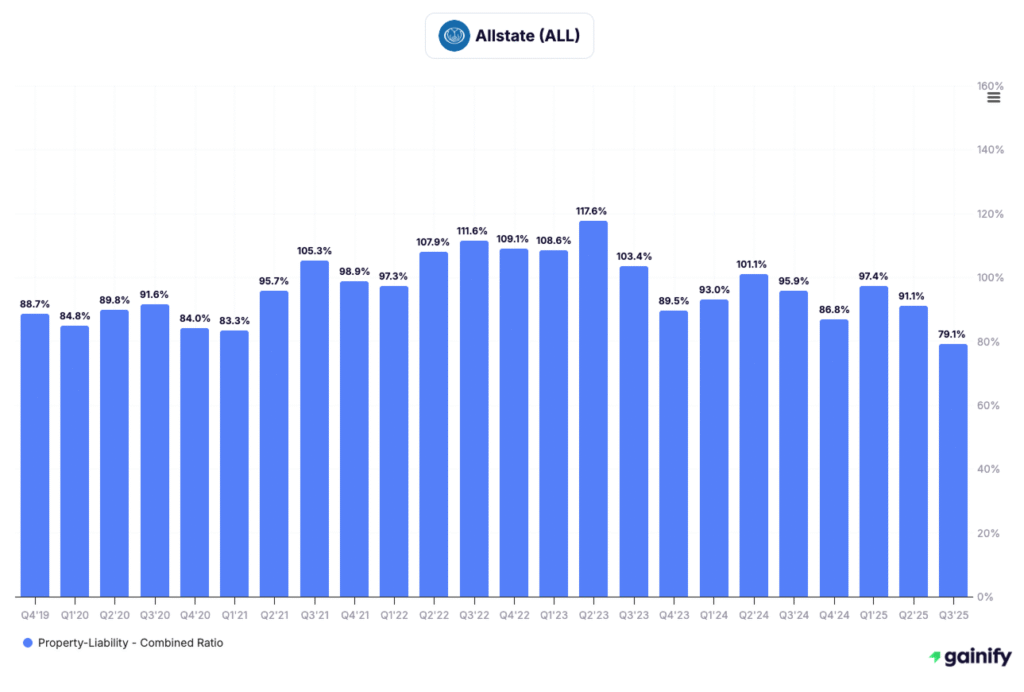
Allstate is one of the largest personal lines insurers in the United States, with a franchise built on brand scale, distribution breadth and a rapidly modernizing operating model. The company’s Transformative Growth program has reshaped pricing, claims and distribution, allowing Allstate to restore margins and reaccelerate customer growth after several challenging years. In Q3 2025 the company delivered its strongest operational performance in years, reflecting meaningful improvements in auto profitability, continued strength in homeowners and a sizable uplift in investment income.
Recent Developments (Q3 2025)
Allstate’s third quarter highlighted a clear inflection in earnings power.
- Revenue reached 17.3 billion dollars, up almost four percent year over year, with property-liability premiums increasing 6.1 percent to 14.5 billion dollars.
- Adjusted net income surged to 2.98 billion dollars, with EPS of 11.17, more than doubling the prior-year period as margins normalized.
- Investment income climbed 21 percent to 949 million dollars, and return on equity expanded to 34.7 percent, supported by stronger underwriting and improved portfolio yield. Policies in force increased 3.8 percent, with growth across both auto and homeowners.
Investment Thesis
Allstate is transitioning from repair mode into a period of earnings expansion. The company has restored auto margins to targeted levels through rate adequacy, improved claims execution and expense discipline. Homeowners continues to deliver stable profitability, providing a second engine of earnings stability. The fixed-income portfolio is now positioned to benefit from elevated reinvestment yields, giving Allstate strong visibility into higher investment income through 2026. Combined with a more efficient distribution structure and regained customer momentum, Allstate enters the next phase of the cycle with a materially cleaner earnings setup.
Key Risks
Auto severity trends remain the most important variable and could reaccelerate if repair or injury costs rise. State-level regulatory environments may slow or cap necessary rate adjustments. Competitive pressure in personal auto is increasing as peers regain profitability, and a sharper decline in interest rates could temper the investment income tailwind.
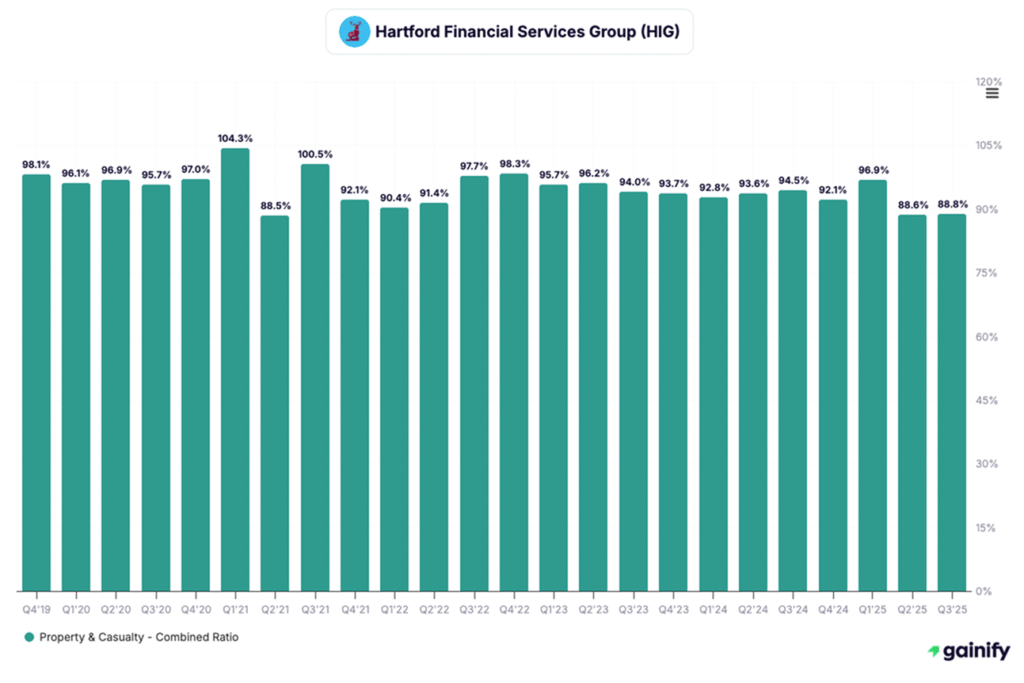
5. Hartford Financial Services (NYSE: HIG)
Market cap 38.02B
Forward P/E 10.88x
Forward ROE 18.82 percent
Analyst Forecasted Upside 4.11 percent
Overview
Hartford is one of the most disciplined multiline commercial insurers in the US market, with meaningful scale across small commercial, middle market, specialty and group benefits. The company’s underwriting culture and tight control of expense ratios remain core competitive strengths, and its franchise in small commercial continues to be one of the highest-quality books in the industry. In Q3 2025 Hartford again delivered clean execution with solid underwriting profitability, stable pricing across key lines and strong capital generation supporting both organic growth and shareholder returns.
Recent Developments (Q3 2025)
Hartford’s Q3 results demonstrated continued operational consistency.
- Core earnings grew year over year, driven by strong underwriting across Commercial Lines and healthy margins in Group Benefits, partially offset by normalizing investment yield tailwinds.
- Property and casualty written premiums expanded, supported by disciplined rate actions and exposure growth across small commercial and middle market.
- Capital deployment remained active, with continued share repurchases and sustained investment in underwriting and digital capabilities.
Investment Thesis
Hartford offers one of the cleanest setups in US multiline insurance heading into 2026. Its commercial franchise continues to compound profitably, supported by favorable pricing, a high-quality renewal book and prudent risk selection. Group Benefits adds a second recurring earnings engine with attractive margins and strong persistency. Book value growth is accelerating as underwriting profits and stable investment income lift capital generation. With balanced business mix, consistent execution and a conservative reserving philosophy, Hartford provides a strong visibility profile and resilient earnings trajectory through the next leg of the cycle.
Key Risks
Commercial casualty severity trends remain a structural risk and could pressure loss ratios if inflation re-accelerates. Group Benefits earnings remain sensitive to interest rate movements and claims volatility. Competitive intensity in commercial lines is rising as industry profitability improves, which may constrain rate momentum.
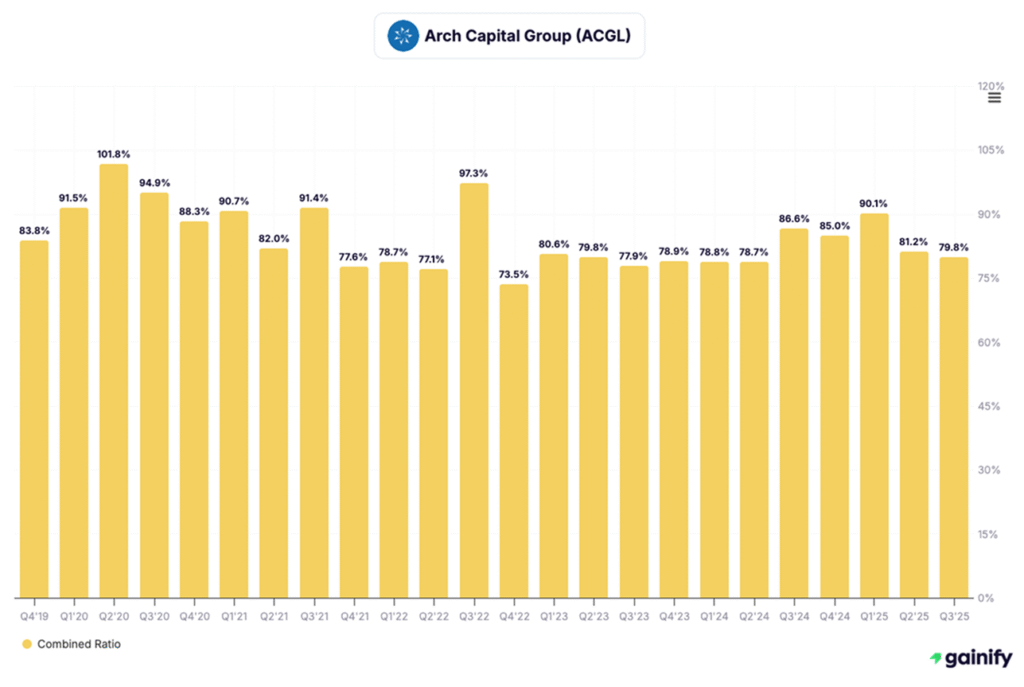
6. Arch Capital (NASDAQ: ACGL)
Market cap 33.39B
Forward P/E 10.06x
Forward ROE 15.86 percent
Analyst Forecasted Upside 16.55 percent
Overview
Arch is one of the strongest diversified specialty carriers in global P&C, operating across insurance, reinsurance and mortgage with a model built on underwriting rigor, cycle discipline and conservative balance sheet management. The company’s ability to allocate capital across three distinct profit pools has allowed it to compound book value through multiple market environments. In Q3 2025 Arch continued to deliver top-tier results, supported by strong specialty growth, disciplined property-cat exposure and a mortgage platform that remains a steady, high-return engine.
Recent Developments (Q3 2025)
Arch’s Q3 performance highlighted the breadth and quality of its earnings.
- Gross premiums written over the trailing twelve months reached 22.8 billion dollars, up meaningfully from the prior year across both specialty insurance and reinsurance.
- Net investment income and equity-method income climbed to roughly 542 million dollars for the quarter on an asset base of 46.7 billion dollars, reflecting stronger reinvestment yields and private portfolio gains.
- Mortgage insurance remained a key contributor, with risk in force of about 495 billion dollars and underwriting income near 1 billion dollars over the last twelve months, supported by low delinquency levels and stable credit performance.
Investment Thesis
Arch offers a differentiated, multi-engine earnings model that compounds capital more efficiently than most P&C peers. Specialty insurance continues to scale with strong margins, reinsurance benefits from cycle-aware risk selection, and mortgage provides a high-return, lower-volatility complement that smooths earnings through the cycle. With investment income rising, property-cat exposure tightly controlled and multiple underwriting platforms performing simultaneously, Arch carries one of the cleanest earnings setups in the sector heading into 2026. Its long record of prudent reserving and disciplined capital deployment enhances visibility and mitigates downside risk relative to other global reinsurers.
Key Risks
Arch remains exposed to volatility from large catastrophe events across its property and reinsurance books. A deterioration in housing or labor markets could weaken mortgage credit performance. Competitive pressure in specialty and reinsurance may intensify as industry results improve, and a faster decline in interest rates would reduce the tailwind from investment income, though the company’s balance sheet positioning provides some insulation.
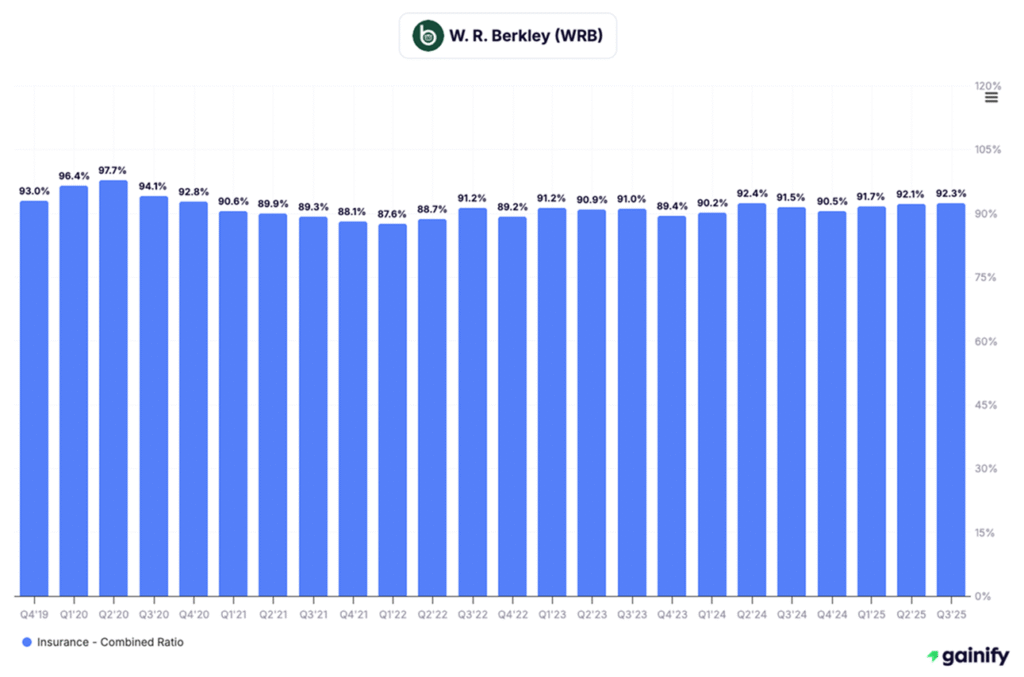
7. W. R. Berkley (NYSE: WRB)
Market cap 29.68B
Forward P/E 18.15x
Forward ROE 19.00 percent
Analyst Forecasted Upside negative 4.99 percent
Overview
W. R. Berkley is one of the most consistently profitable specialty commercial insurers in the US, built around a decentralized operating model and deep underwriting expertise across niche segments. The company focuses on short-tail specialty and excess & surplus lines where pricing precision and cycle management matter most. WRB’s disciplined approach, conservative reserving and strong capital stewardship have allowed it to deliver high returns on equity through multiple industry cycles. In Q3 2025 the franchise again produced stable growth, clean underwriting and rising investment income.
Recent Developments (Q3 2025)
WRB’s third quarter reflected continued strength across underwriting and investment operations.
- Net premiums earned increased to roughly 3.16 billion dollars, supported by sustained growth in specialty commercial and E&S markets.
- Net investment income rose to around 351 million dollars, benefiting from higher book yields and solid performance in alternative strategies.
- Net income reached about 511 million dollars, and shareholders’ equity increased toward 9.8 billion dollars as retained earnings and improving unrealized positions lifted capital levels.
Investment Thesis
W. R. Berkley offers a high-quality, low-volatility earnings profile grounded in cycle-aware underwriting and conservative financial management. Specialty commercial lines continue to deliver attractive rate adequacy, underwriting margins remain well controlled and investment income holds a multi-year tailwind from elevated reinvestment yields. WRB’s decentralized structure allows each operating unit to maintain strict return hurdles, creating a sustained competitive advantage and supporting consistently strong ROE. As the market transitions into a more competitive phase, Berkley’s disciplined risk selection and balanced portfolio give it one of the most resilient setups heading into 2026.
Key Risks
Commercial pricing could soften as more capacity enters the market. Catastrophe exposure, while modest relative to peers, remains a source of periodic earnings volatility. A faster decline in interest rates would temper the investment income uplift, and competitive pressure in specialty lines may gradually compress margins.
Positioning for 2026: The US P&C Setup
The US P&C industry enters 2026 with one of the cleanest operating environments in years. Rate momentum has eased from its peak but remains disciplined across most commercial lines, while personal auto loss trends have normalized after a multi-year reset. Catastrophe pricing is firmer, exposure growth has improved and the underwriting margin recovery across leading carriers is now broadly complete.
Investment income is beginning to soften as rates drift lower, but most insurers locked in higher book yields during the tightening cycle. That carry advantage provides meaningful cushion, keeping earnings stable even as the reinvestment backdrop becomes less favorable.
Competition is rising as capital flows back into the sector, yet the top-tier carriers continue to separate from the field. Their edge in analytics, segmentation, claims execution and capital discipline is widening, not narrowing, which supports sustained underwriting profitability even in a more crowded market.
Taken together, the US P&C sector enters 2026 with one of the strongest combinations of margin durability, balance-sheet resilience and pricing agility anywhere in financial services. The companies highlighted in this report are the best positioned to convert that environment into consistent earnings compounding over the next several years.