
The top 10 U.S. bank stocks have shown steady results in 2025 but have underperformed the S&P 500 by about seven percentage points. Earnings have remained resilient thanks to strong capital positions, solid credit quality, and cost discipline, yet the operating environment is becoming more challenging.
With interest rates now trending lower, net interest margins are narrowing as loan yields decline faster than deposit costs. Loan growth has slowed, and funding expenses remain high, creating pressure on profitability. Credit performance is still robust, with nonperforming loans near record lows, but isolated stress in commercial real estate and small-business lending has sparked debate about whether lending standards have loosened too much.
Despite these headwinds, the largest U.S. banks continue to benefit from scale, digital infrastructure, and diversified income streams. Regionals are emphasizing efficiency, deposit stability, and prudent capital allocation as they navigate the late phase of the rate cycle. Together, these ten institutions hold more than 14 trillion dollars in assets and around 1.9 trillion dollars in market value, anchoring the U.S. financial system and shaping the outlook for the sector.
In the sections that follow, this report presents the top 10 U.S. bank stocks, explaining what each bank does, how it performed in the third quarter of 2025, and what its positioning reveals about the future of the industry.
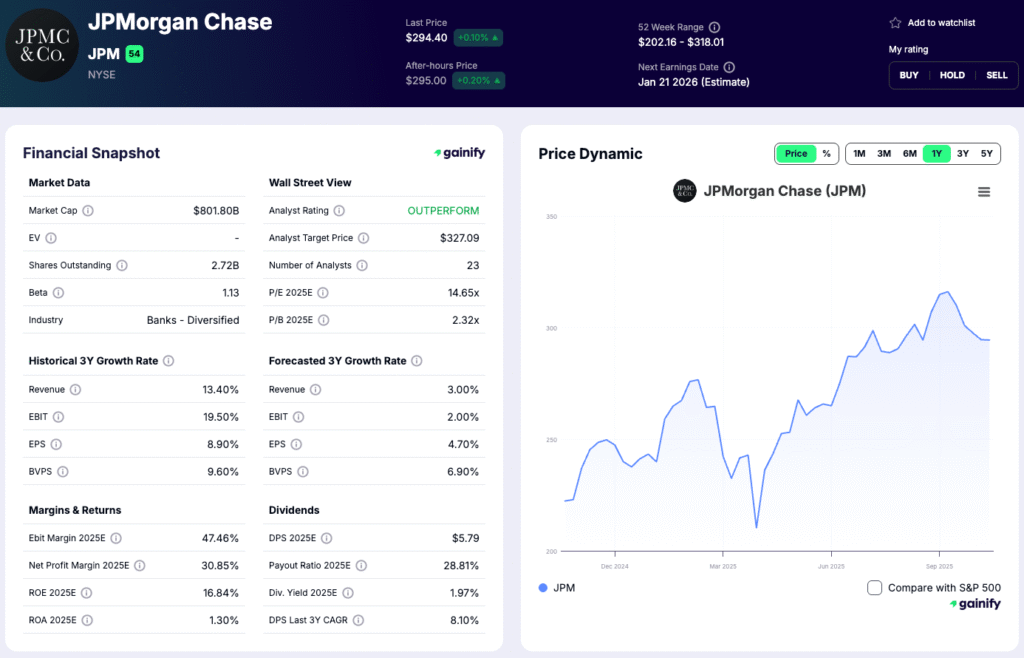
1. JPMorgan Chase & Co. (JPM)
Market Capitalization: 801.8 billion USD
Total Assets: 4.56 trillion USD
Forward Return on Equity: 16.8 percent
P/B: 2.32x
CET1 Ratio (Q3 2025): 14.8 percent
What the Bank Does
JPMorgan Chase (NYSE:JPM) is the largest bank in the United States and a global leader in diversified financial services. It operates through four primary segments: Consumer and Community Banking, Corporate and Investment Banking, Commercial Banking, and Asset & Wealth Management. The bank’s revenue base spans retail and corporate lending, payments, trading, advisory services, and investment management, making it one of the most balanced financial institutions worldwide.
Q3 2025 Highlights
- Net income of 14.4 billion USD, with a return on equity of 17 percent
- Managed revenue of 47 billion USD, up 5 percent year over year
- Investment-banking fees rose 10 percent quarter over quarter
- Efficiency ratio around 52 percent, reflecting strong cost discipline
- CET1 ratio of 14.8 percent, well above regulatory minimums
Investment View
JPMorgan remains the benchmark for financial strength and profitability among global banks. Its scale, diversified earnings, and technology-driven efficiency support consistent compounding of book value and dividends. For investors seeking quality exposure to the banking sector, it offers a rare combination of stability, growth, and capital return.
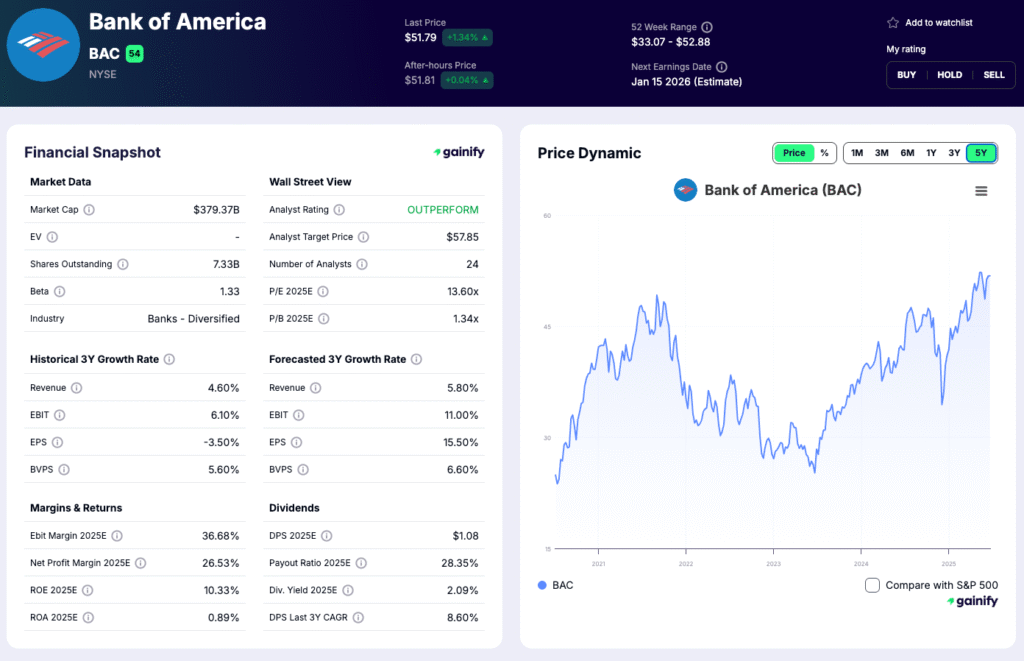
2. Bank of America (BAC)
Market Capitalization: 379.4 billion USD
Total Assets: 3.40 trillion USD
Forward Return on Equity: 10.3 percent
P/B: 1.34x
CET1 Ratio (Q3 2025): 12.8 percent
What the Bank Does
Bank of America (NYSE: BAC) is one of the largest consumer and corporate banks in the United States, serving more than 68 million clients across retail banking, wealth management, and global banking services. Its operations span consumer deposits and lending, corporate and investment banking, trading, and asset management through its Merrill and Private Bank divisions. The bank’s diversified model blends stable deposit funding with fee income from wealth and advisory businesses.
Q3 2025 Highlights
- Net income of 8.5 billion USD, supported by steady loan and fee growth
- Net interest income up 3 percent year over year
- Net interest margin of 2.9 percent
- Digital adoption remains strong, with 83 percent of consumer transactions completed online or via mobile
- CET1 ratio of 12.8 percent, reflecting solid capital strength
Investment View
Bank of America’s scale, low-cost deposit base, and leading digital platform provide durable earnings power across interest-rate cycles. Its diversified mix of retail, wealth, and corporate businesses positions it as a consistent compounder in a normalizing rate environment. Continued focus on technology, expense control, and capital return supports long-term shareholder value.
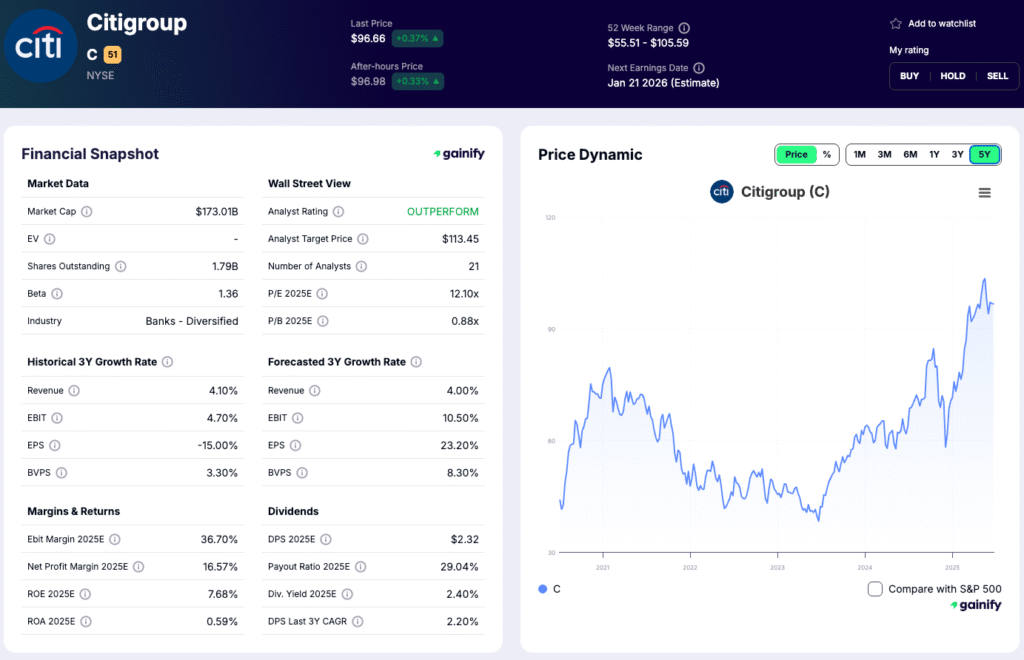
3. Citigroup (C)
Market Capitalization: 173.0 billion USD
Total Assets: 2.64 trillion USD
Forward Return on Equity: 7.7 percent
P/B: 0.88x
CET1 Ratio (Q3 2025): 13.7 percent
What the Bank Does
Citigroup (NYSE:C) is one of the world’s most globally diversified financial institutions, operating in over 90 countries. Its core businesses include Treasury and Trade Solutions (TTS), Markets, Investment Banking, U.S. Personal Banking, and Wealth Management. The bank provides multinational clients with cross-border payments, liquidity management, and risk-hedging solutions, while maintaining a growing U.S. consumer presence through credit cards and retail lending.
Q3 2025 Highlights
- Revenue of 22.1 billion USD, up 4 percent year over year
- Net income of 3.8 billion USD
- Return on tangible common equity (ROTCE), excluding Banamex impact: approximately 9.7 percent
- Services revenue up 8 percent; Markets revenue up 5 percent
- CET1 ratio of 13.7 percent, reflecting a strong capital position
Investment View
Citigroup remains in the midst of a multiyear transformation aimed at simplifying its structure and improving returns. Its global network and institutional client franchise are valuable competitive advantages that could drive stronger profitability once the restructuring is complete. As management executes on cost reduction and business realignment, Citigroup offers long-term potential for multiple expansion and higher shareholder returns.
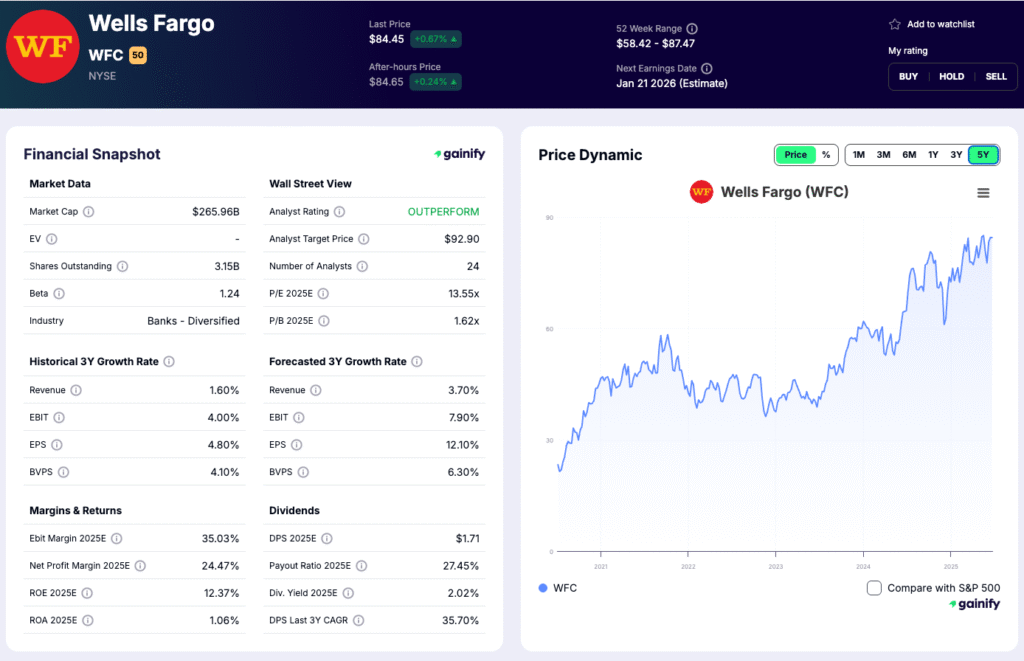
4. Wells Fargo (WFC)
Market Capitalization: 266.0 billion USD
Total Assets: 2.06 trillion USD
Forward Return on Equity: 12.4 percent
P/B: 1.62x
CET1 Ratio (Q3 2025): 11.0 percent
What the Bank Does
Wells Fargo (NYSE: WFC) is one of the largest retail and commercial banks in the United States, with longstanding strengths in mortgages, consumer banking, and small-business lending. The bank generates revenue primarily through net interest income, service fees from cards and payments, and advisory income from wealth and investment services. Its well-diversified loan portfolio spans consumer, commercial, and real estate lending.
Q3 2025 Highlights
- Net income of 5.6 billion USD
- Efficiency ratio of 60 percent, improving year over year
- Net interest income up 2 percent compared with the prior year
- CET1 ratio of 11 percent, reflecting a strong capital position
- Loan book remains balanced across retail and commercial segments
Investment View
Wells Fargo’s focus on expense reduction, risk control, and regulatory remediation continues to strengthen profitability and restore credibility. As cost efficiencies materialize, returns are moving closer to peer averages. With stable credit metrics and capital flexibility, Wells Fargo is positioned for steady earnings growth through 2026.
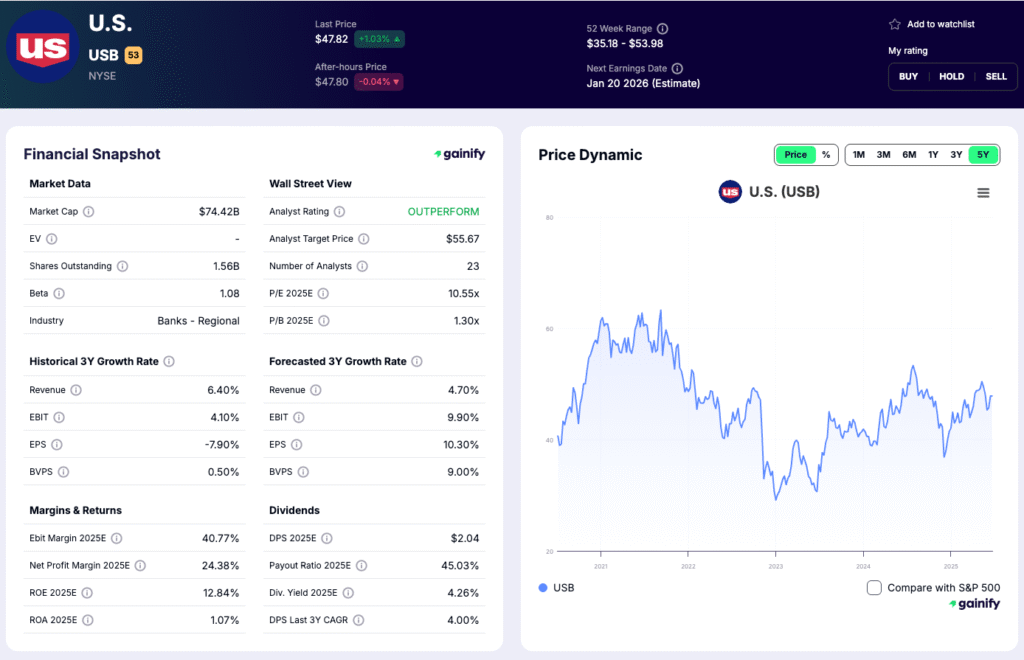
5. U.S. Bancorp (USB)
Market Capitalization: 73.7 billion USD
Total Assets: 695.4 billion USD
Forward Return on Equity: 12.8 percent
P/B: 1.30x
CET1 Ratio (Q3 2025): 10.0 percent
What the Bank Does
U.S. Bancorp (NYSE:USB) is the fifth-largest bank in the United States and a leading provider of consumer, business, and payment services. It combines a traditional regional banking model with a national payments platform that supports merchants, corporates, and governments. The bank earns from lending, card processing, treasury management, and trust and investment services, with a reputation for strong credit discipline and operational efficiency.
Q3 2025 Highlights
- Net revenue of 7.3 billion USD, up 4 percent year over year
- Net income of 2.0 billion USD, with return on equity of approximately 14 percent
- Net interest margin around 3.0 percent
- Efficiency ratio of 54 percent, among the best in the sector
- CET1 ratio of 10.0 percent, reflecting a conservative balance sheet
Investment View
U.S. Bancorp continues to deliver reliable earnings through disciplined lending, strong fee income, and a leading position in payments. Its consistent profitability, robust risk management, and focus on digital innovation make it one of the most stable regional banks in the United States. As funding costs normalize, the bank is well placed to sustain double-digit returns and shareholder distributions.
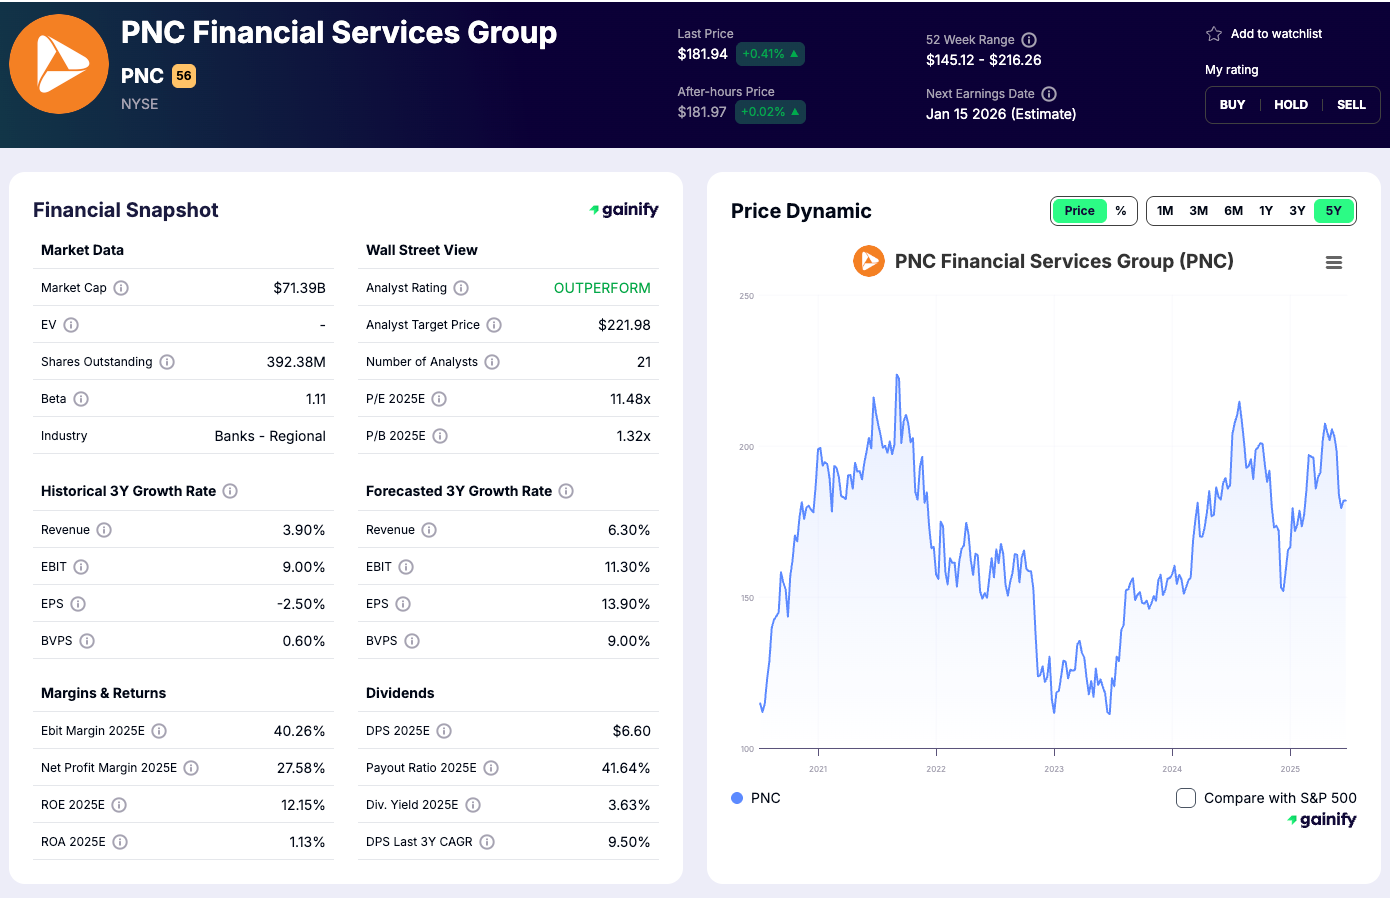
6. PNC Financial Services (PNC)
Market Capitalization: 71.1 billion USD
Total Assets: 568.8 billion USD
Forward Return on Equity: 12.2 percent
P/B: 1.32x
CET1 Ratio (Q3 2025): 9.9 percent
What the Bank Does
PNC Financial Services (NYSE:PNC) is one of the largest diversified regional banks in the United States, offering retail banking, corporate banking, wealth management, and asset management services. The bank has a strong presence across the Midwest, Mid-Atlantic, and Southeast, and a growing national platform for corporate clients. Its revenue is balanced between interest income from lending and noninterest income from capital markets, treasury management, and investment services.
Q3 2025 Highlights
- Net income of 1.8 billion USD, with earnings per share of 4.35 USD
- Efficiency ratio of 58.5 percent, an improvement from 61 percent a year earlier
- Noninterest income up 8 percent quarter over quarter, led by stronger advisory and syndication activity
- CET1 ratio near 10 percent, reflecting conservative capital management
- Loan growth of 2 percent year over year, driven by commercial and industrial lending
Investment View
PNC combines disciplined risk management with a diversified earnings base and a strong capital position. Its focus on efficiency and fee growth supports steady profitability even as loan demand slows. With a proven record of prudent expansion and shareholder returns, PNC remains a reliable core holding among high-quality regional bank stocks.
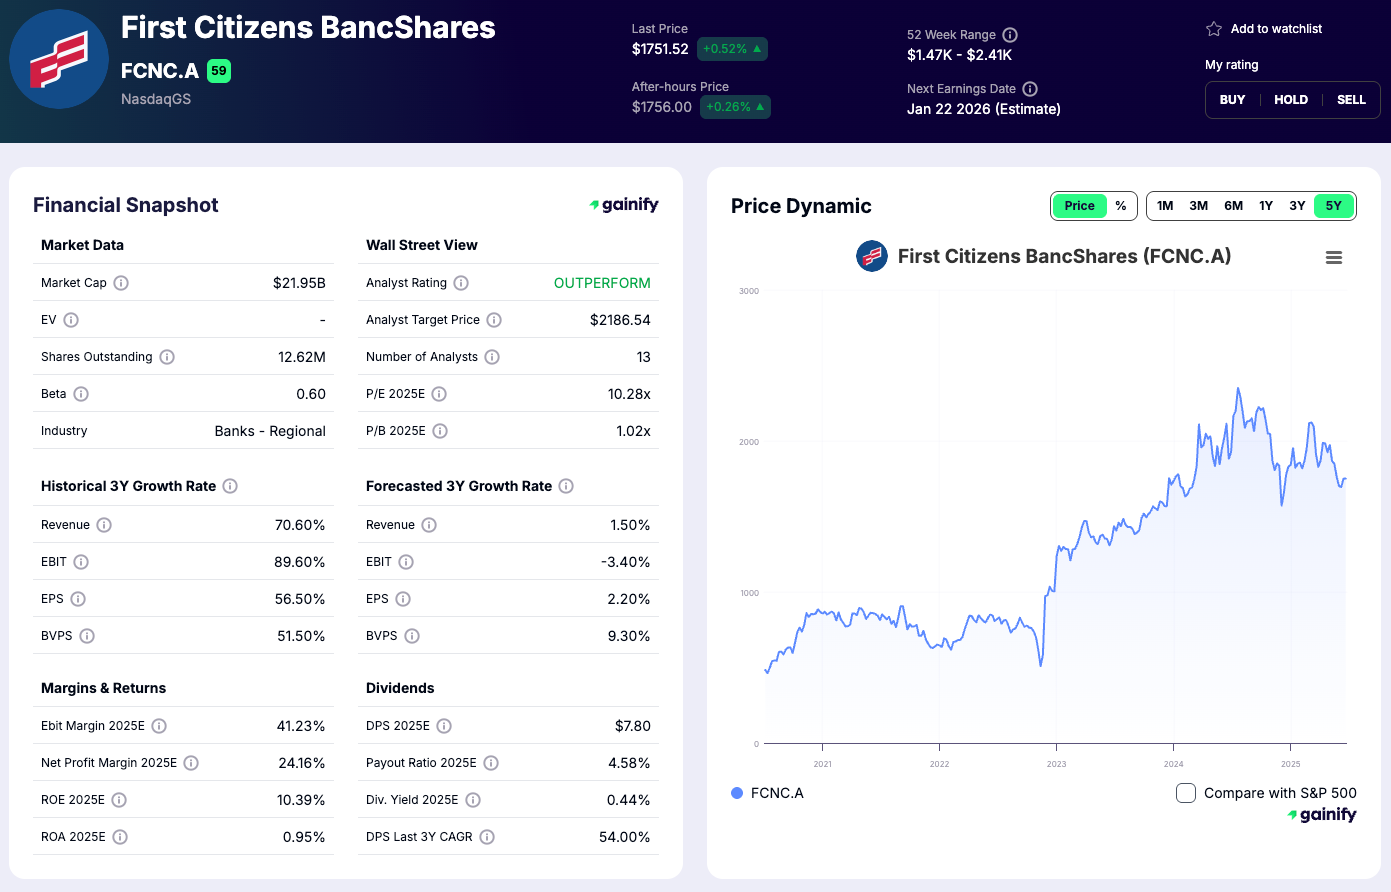
7. First Citizens BancShares (FCNC.A)
Market Capitalization: 22.4 billion USD
Total Assets: 229.7 billion USD
Forward Return on Equity: 10.5 percent
P/B: 1.02x
CET1 Ratio (Q3 2025): 12.1 percent
What the Bank Does
First Citizens BancShares (NASDAQ:FCNC.A) is a fast-growing U.S. commercial and retail bank headquartered in North Carolina. The bank expanded significantly through acquisitions, most notably its 2023 purchase of Silicon Valley Bank assets, which added a large base of technology and venture-related clients. First Citizens now operates a diversified franchise across commercial lending, consumer banking, wealth management, and specialty finance, with a focus on relationship-driven service and disciplined underwriting.
Q3 2025 Highlights
- Earnings per share of 44.6 USD
- Total revenue of 2.4 billion USD
- Deposit growth of 3 percent quarter over quarter, reflecting strong client retention
- Efficiency ratio around 57 percent, demonstrating solid operating leverage
- CET1 ratio of 12.1 percent, indicating a robust capital position
Investment View
First Citizens continues to benefit from its transformative acquisition of Silicon Valley Bank, which has expanded its national footprint and boosted profitability. The integration process is progressing well, with improving efficiency and stable credit trends. Its strong capital base and conservative risk culture position the bank to sustain attractive long-term returns as merger synergies and funding advantages are realized.
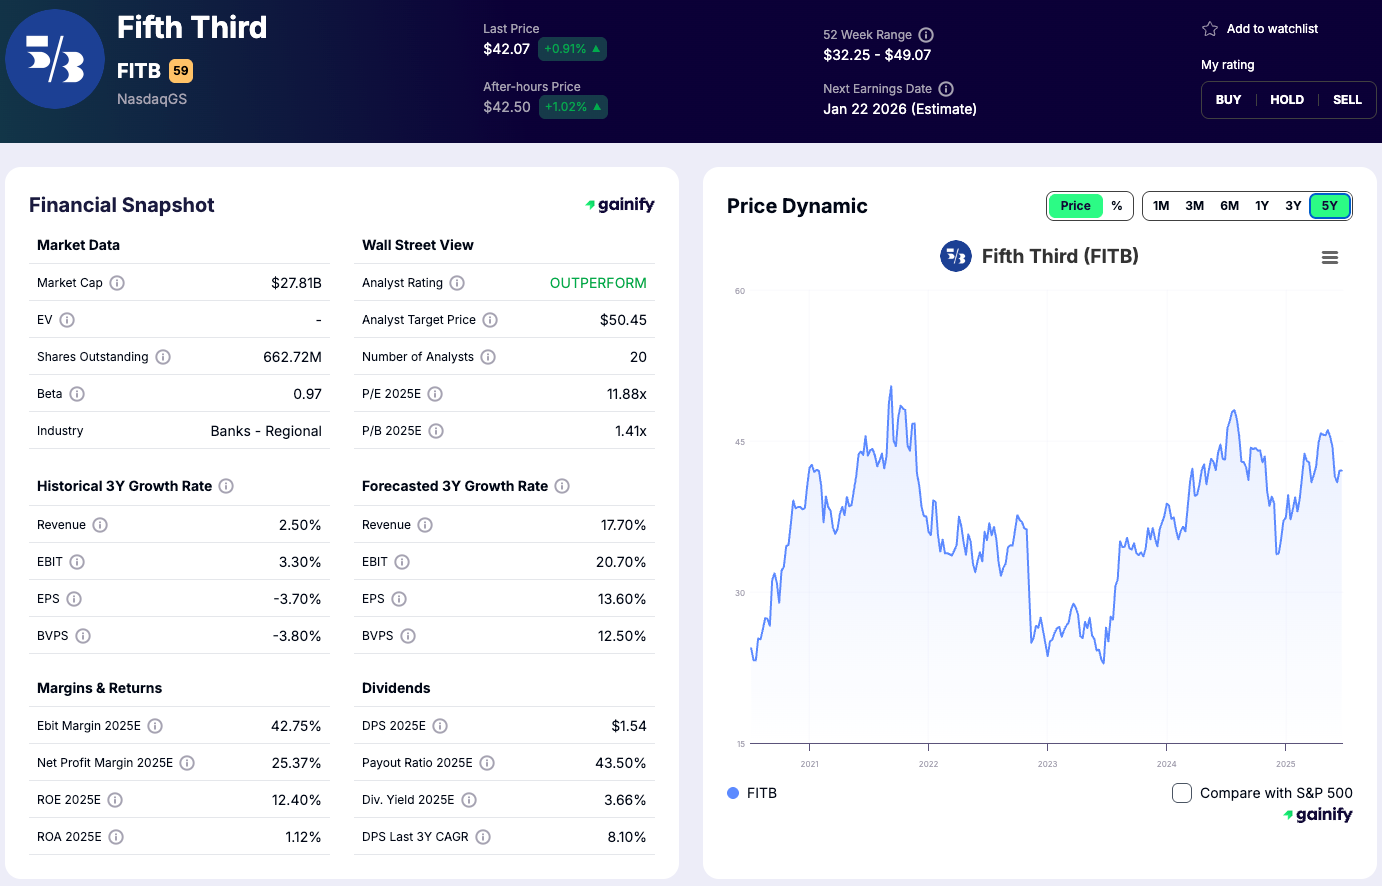
8. Fifth Third Bancorp (FITB)
Market Capitalization: 27.6 billion USD
Total Assets: 212.9 billion USD
Forward Return on Equity: 12.1 percent
P/B: 1.41x
CET1 Ratio (Q3 2025): 10.5 percent
What the Bank Does
Fifth Third Bancorp (NASDAQ:FITB) is a leading regional bank headquartered in Cincinnati, Ohio, with a strong presence across the Midwest and Southeast. It provides a full range of services in consumer banking, commercial lending, treasury management, wealth management, and capital markets. The bank’s strategy emphasizes risk discipline, conservative credit standards, and steady organic growth supported by a strong deposit franchise.
Q3 2025 Highlights
- Earnings per share of 0.91 USD
- Return on equity around 13 percent
- Treasury management fees up 5 percent quarter over quarter
- Efficiency ratio of approximately 59 percent, stable year over year
- CET1 ratio of 10.5 percent, reflecting a solid capital base
Investment View
Fifth Third continues to demonstrate consistent profitability and sound asset quality. Its prudent credit culture, diversified revenue mix, and strong capital levels provide resilience in a moderating rate environment. The bank’s disciplined approach to balance-sheet management positions it well for steady earnings growth and competitive shareholder returns over the medium term.
Industry Trends: Banking in Transition
The U.S. banking industry in late 2025 is navigating a complex but manageable adjustment phase. After two years of elevated interest rates and strong profitability, the sector is now transitioning toward a lower-rate environment, slower loan growth, and renewed attention to credit quality and efficiency. Several key trends define the landscape for the largest banks:
1. Margins Under Pressure as Rates Decline
With the Federal Reserve beginning to ease policy, net interest margins are compressing across the industry. Loan yields are adjusting downward more quickly than deposit costs, particularly for banks with large retail funding bases. As a result, management teams are focusing on fee generation, balance-sheet mix optimization, and hedging strategies to protect earnings.
2. Credit Quality Remains Strong but Scrutiny Is Rising
Credit losses remain low, supported by healthy consumer balance sheets and moderate corporate leverage. However, isolated credit events in commercial real estate, construction, and small-business lending have raised investor caution. The conversation is shifting from loan growth to credit discipline, with banks tightening underwriting standards while maintaining selective exposure to high-quality borrowers.
3. Deposit Stability and Funding Competition
Deposit outflows that marked 2023 and early 2024 have largely stabilized, but competition for funding remains elevated. Large banks with diversified retail and corporate deposits continue to enjoy an advantage over smaller peers that rely more heavily on time deposits or wholesale funding. Improving liquidity coverage and maintaining customer retention remain top priorities.
4. Fee Income Recovery and Business Diversification
Capital markets activity and wealth management revenues are recovering as financial conditions stabilize. Trading, advisory, and asset-management divisions are once again contributing meaningfully to earnings growth. For diversified institutions such as JPMorgan and Bank of America, these businesses provide important offsets to pressure on net interest income.
5. Cost Control and Digital Efficiency
Across the industry, banks are accelerating cost-reduction initiatives and investing heavily in automation, data analytics, and digital client engagement. Technology investment is no longer discretionary but a core competitive necessity. The largest institutions are leveraging digital scale to drive down unit costs and enhance cross-selling across products and segments.
6. Capital Strength and Shareholder Returns
Capital positions remain strong, with CET1 ratios comfortably above regulatory minimums. As credit costs stay low and earnings remain solid, banks are increasing share repurchases and dividends. The industry’s capital flexibility provides investors with consistent total-return potential even in a lower-growth environment.
Key Highlights as of Q3 2025
- Earnings Hold Firm, Margins Narrowing: the top U.S. banks delivered over 55 billion USD in combined quarterly profit, underscoring strong core performance. Net interest margins are tightening as rates fall, but fee income and cost control continue to offset the drag.
- Credit Quality Strong but Watchlist Growing: nonperforming loans remain low, yet early weakness in commercial real estate and small-business lending is emerging. Credit normalization is underway, marking the first shift from years of ultra-low loss rates.
- Valuation Gaps Widen: the sector has lagged the S&P 500 by about seven percentage points in 2025. Investors are rewarding high-return, well-capitalized banks like JPMorgan and U.S. Bancorp, while laggards trade below book value on structural or execution risks.
- Digital Scale Drives Efficiency: over 80 percent of retail transactions are now digital, helping top banks maintain efficiency ratios near 55 percent. Technology spending is translating into better cost leverage and customer retention across the largest franchises.
- Capital and Payouts Stay Robust: with an average CET1 ratio near 12 percent, the group maintains ample capacity for dividends and buybacks. Payout ratios around 35–40 percent highlight capital strength and shareholder focus despite margin pressure.