
Knowing how to calculate return on equity (ROE) helps investors quickly decide whether a business warrants deeper analysis or immediate rejection.
Return on Equity (ROE) shows how effectively management converts shareholder capital into profit and whether those returns are driven by durable operations or financial engineering.
Knowing how to calculate and interpret ROE gives you a deeper understanding of how a company truly operates. It helps you see whether profits are built on solid fundamentals or borrowed leverage, and whether the business can keep growing over time.
For anyone building a disciplined, high-quality investment portfolio, mastering ROE is one of the most powerful tools for smarter investing.
Key Highlights
- Return on Equity (ROE) shows how effectively a company turns shareholder capital into profits.
- High and stable ROE signals efficient management and a sustainable competitive edge.
- Learning to calculate and use ROE helps investors identify quality businesses and build stronger portfolios.
What is Return on Equity (ROE)?
Return on Equity (ROE) is a financial metric that demonstrates how much net income a company generates for each dollar of shareholders’ equity. It is a primary indicator of a company’s profitability and the efficiency with which its management is using the capital invested by its shareholders.
ROE matters because equity is the most expensive form of capital. Shareholders expect returns that compensate them for risk over time. A company that consistently earns a high return on equity demonstrates an ability to deploy capital efficiently and reinvest profits at attractive rates.
At the same time, ROE is not a pure operating metric. Leverage, share repurchases, and accounting choices can all influence the ratio, sometimes making performance appear stronger than it truly is. For this reason, ROE works best as an initial filter rather than a final verdict on business quality.
When evaluated across multiple years and compared with industry peers, ROE becomes a reliable indicator of management discipline, balance sheet risk, and the sustainability of a company’s economic returns.
How to Calculate Return on Equity
Calculating return on equity is straightforward, but precision matters. Small mistakes in how the inputs are chosen can materially distort the result and lead to poor conclusions.
Step 1: Identify Net Income
Start with net income from the company’s income statement. This figure represents profit after all operating costs, interest, and taxes have been deducted. Use net income attributable to common shareholders, not adjusted or non-GAAP figures, to maintain consistency.
Step 2: Calculate Average Shareholders’ Equity
Shareholders’ equity changes over time due to retained earnings, buybacks, and capital raises. Using a single balance sheet snapshot can misrepresent how equity was actually employed during the period.
To correct for this, calculate average shareholders’ equity:
Beginning shareholders’ equity + ending shareholders’ equity, divided by two.
This produces a more accurate measure of the capital base used to generate profits.
Step 3: Apply the ROE Formula
Once both inputs are defined, calculate ROE using the standard formula:
Return on Equity = Net Income ÷ Average Shareholders’ Equity
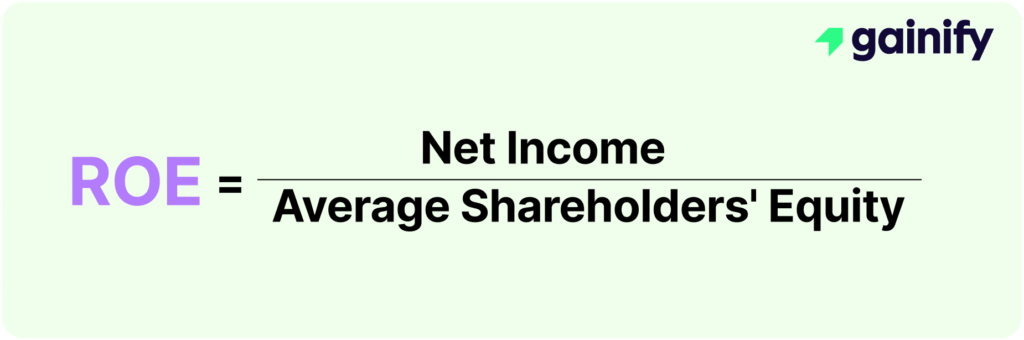
The result is expressed as a percentage and represents the return generated on each dollar of shareholder capital.
Example ROE Calculation
Assume a company reports net income of $80 million for the year.
Shareholders’ equity at the beginning of the year was $700 million, and at the end of the year it was $900 million.
Average shareholders’ equity equals $800 million.
ROE equals $80 million divided by $800 million, or 10 percent.
This means the company generated ten cents of profit for every dollar of equity invested during the year.
Why ROE Matters for Investors
ROE is far more than a simple number; it offers deep insights into a company’s operational excellence and financial health. Here is why it is so important for investors:
- Efficiency in Profit Generation: A higher ROE demonstrates that a company is highly efficient at converting the money shareholders have invested into profits. It directly reflects how effectively management is using its equity capital.
- Indicator of Business Quality: A consistently high ROE over several years often signals a strong business model and superior management. It suggests that the company possesses a sustainable competitive advantage, allowing it to generate robust returns on shareholder capital.
- Support for Long-Term Capital Growth: For investors focused on long-term wealth accumulation, ROE is a critical consideration. Companies with strong ROE can reinvest profits more effectively, leading to accelerated compounding of returns for shareholders.
- Fundamental Analysis Cornerstone: ROE is an integral part of fundamental analysis, helping investors assess a company’s value, track its performance, and make informed investment decisions rooted in financial data.
How ROE Can Mislead Investors
While ROE is an invaluable tool, it is important to understand its nuances and potential limitations to avoid misinterpretations. Relying on ROE in isolation can sometimes lead to an incomplete picture of a company’s financial health.
ROE can be significantly affected by a company’s capital structure. For instance, a company that carries a substantial amount of debt can artificially inflate its ROE because debt reduces the amount of shareholders’ equity in the denominator of the formula. While a high ROE from efficient operations is positive, a high ROE driven primarily by excessive leverage could signal increased financial risk, especially during economic downturns. It is therefore crucial to assess ROE alongside a company’s debt levels and overall balance sheet strength.
Furthermore, accounting choices can influence the reported net income, impacting the ROE figure. One-time gains or losses, or aggressive accounting practices, can temporarily distort a company’s profitability. To gain a true understanding, it is always beneficial to review ROE trends over a five-year period and analyze the quality of earnings and cash flow generation alongside it.
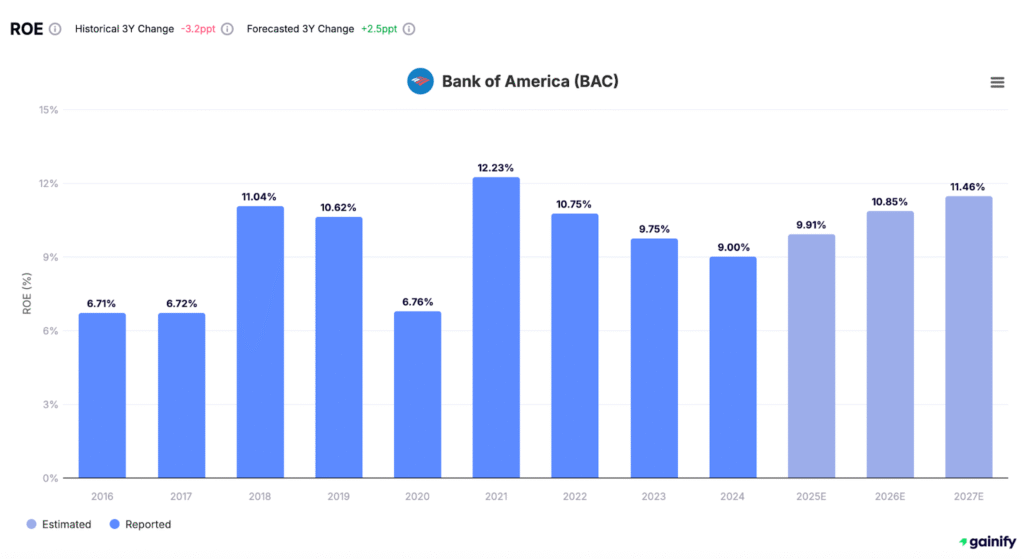
It is also important to consider that while ROE is broadly applicable, its interpretation can vary by industry. For financial institutions like banks, ROE is a heavily used and crucial metric.
However, their business models inherently involve significant leverage (debt), which can magnify ROE. Therefore, for these sectors, it is particularly vital to assess ROE alongside other metrics such as Return on Assets (ROA) and specifically for banks, Net Interest Margin to understand the quality and sustainability of the return.
For other capital-intensive industries, metrics like Return on Invested Capital (ROIC) can provide a clearer picture of operational efficiency unskewed by financial leverage.
Therefore, while ROE is a powerful indicator of shareholder value creation, it works best when integrated into a broader analytical framework. A holistic view, incorporating a range of financial metrics, helps ensure that your investment decisions are grounded in a comprehensive understanding rather than a single data point.
ROE vs. Other Profitability Metrics
To provide a comprehensive view of a company’s performance, ROE is often considered alongside other key profitability metrics. Each offers a distinct perspective:
- Return on Assets (ROA): This metric measures how efficiently a company uses its total assets to generate net income. Unlike ROE, which focuses only on equity, ROA considers all assets, regardless of how they are financed. This makes it particularly useful for comparing companies that might have different debt levels but operate in the same industry. The formula is Net Income / Average Total Assets.
- Return on Invested Capital (ROIC): ROIC assesses how effectively a company uses all forms of capital (both debt and equity) to generate operating profits after tax. It provides a cleaner view of core operational efficiency by removing the distortions of capital structure and tax rates. ROIC is a strong indicator of whether a business creates value above its cost of capital.
Here is a quick comparison:
Feature | ROA | ROIC | ROE |
Profit Measure | Net Income (After Interest & Tax) | NOPAT After-Tax (Net Operating Profit After Tax) | Net Income (After Interest & Tax) |
Capital Base | Average Total Assets | Invested Capital (Operating Assets) | Average Shareholders’ Equity |
Capital Type | Total Assets | Operating Debt + Equity | Shareholder Equity Only |
Tax Adjustment | Yes | Yes | Yes |
Focus | Overall asset efficiency | Value creation versus cost of capital | Shareholder returns, equity-driven profitability |
Real-World ROE Examples
Looking at real company data helps illustrate how ROE varies and what it can tell you:
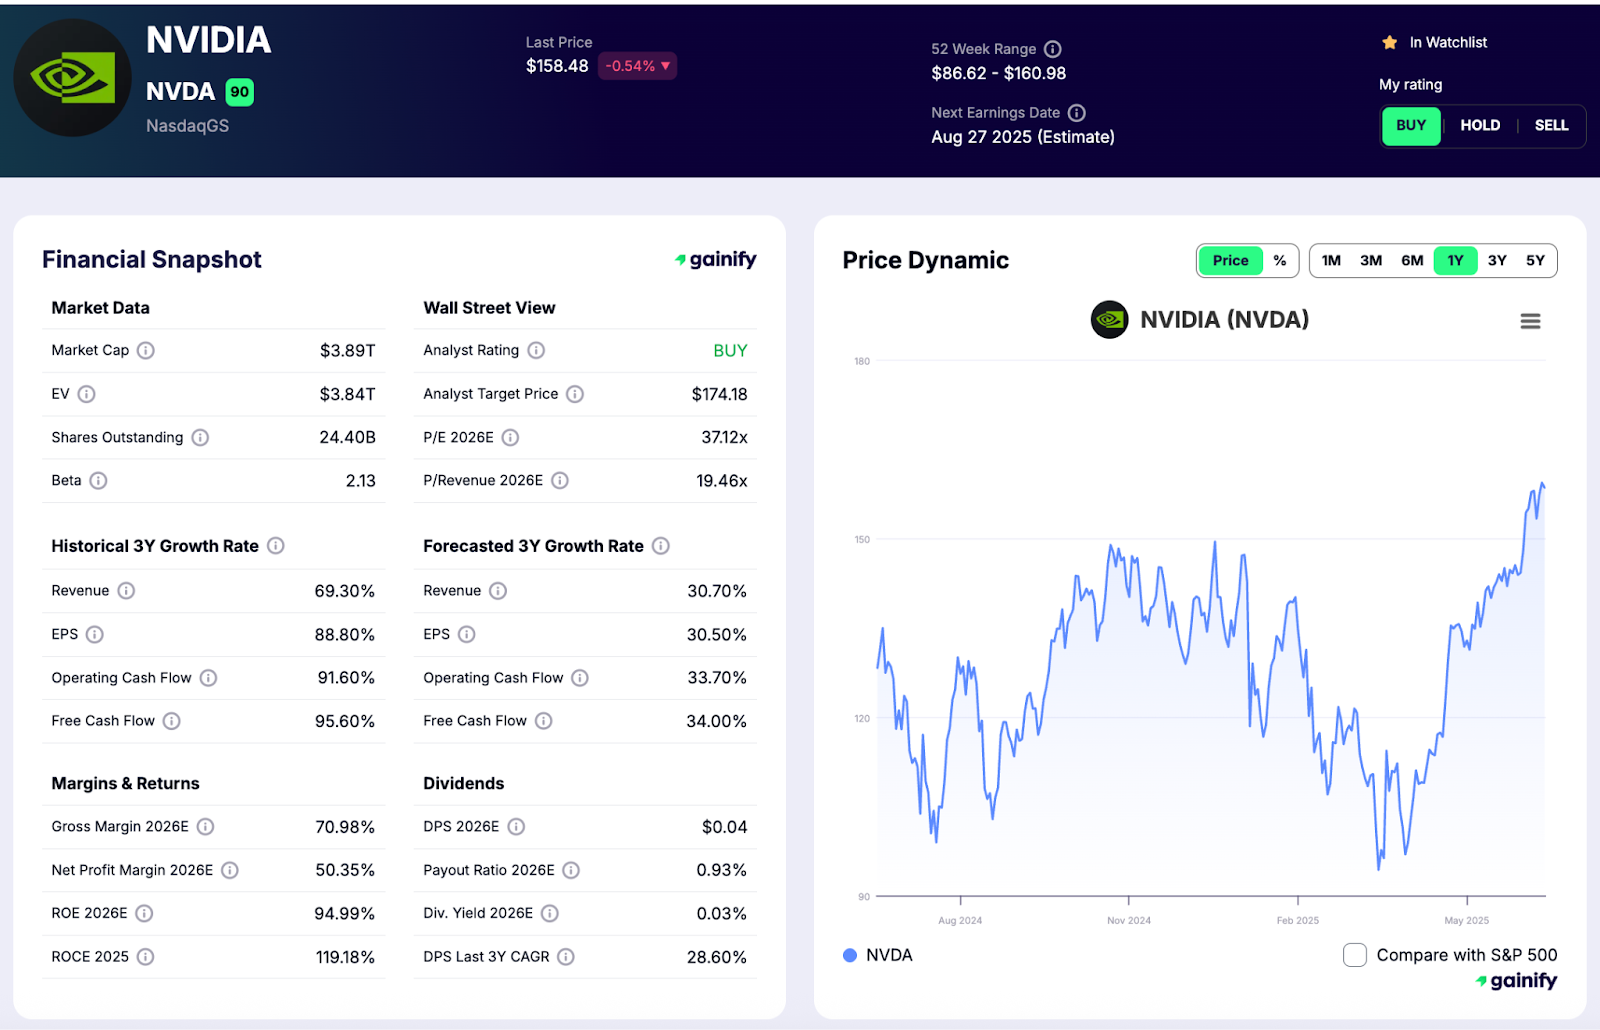
- Nvidia (NASDAQ:NVDA): Nvidia, a leader in AI hardware, showed a remarkably high ROE of 94.99% in 2025 (estimated). This reflects its exceptional efficiency in generating profits relative to shareholder equity, driven by soaring demand for its GPUs in the artificial intelligence sector.
- Mondelez International (NASDAQ:MDLZ): As a global snack leader, Mondelez International had an ROE of 15.05% in 2025 (estimated). This indicates a solid ability to generate profits from shareholder funds in a stable consumer staples industry, backed by strong brands and consistent demand.

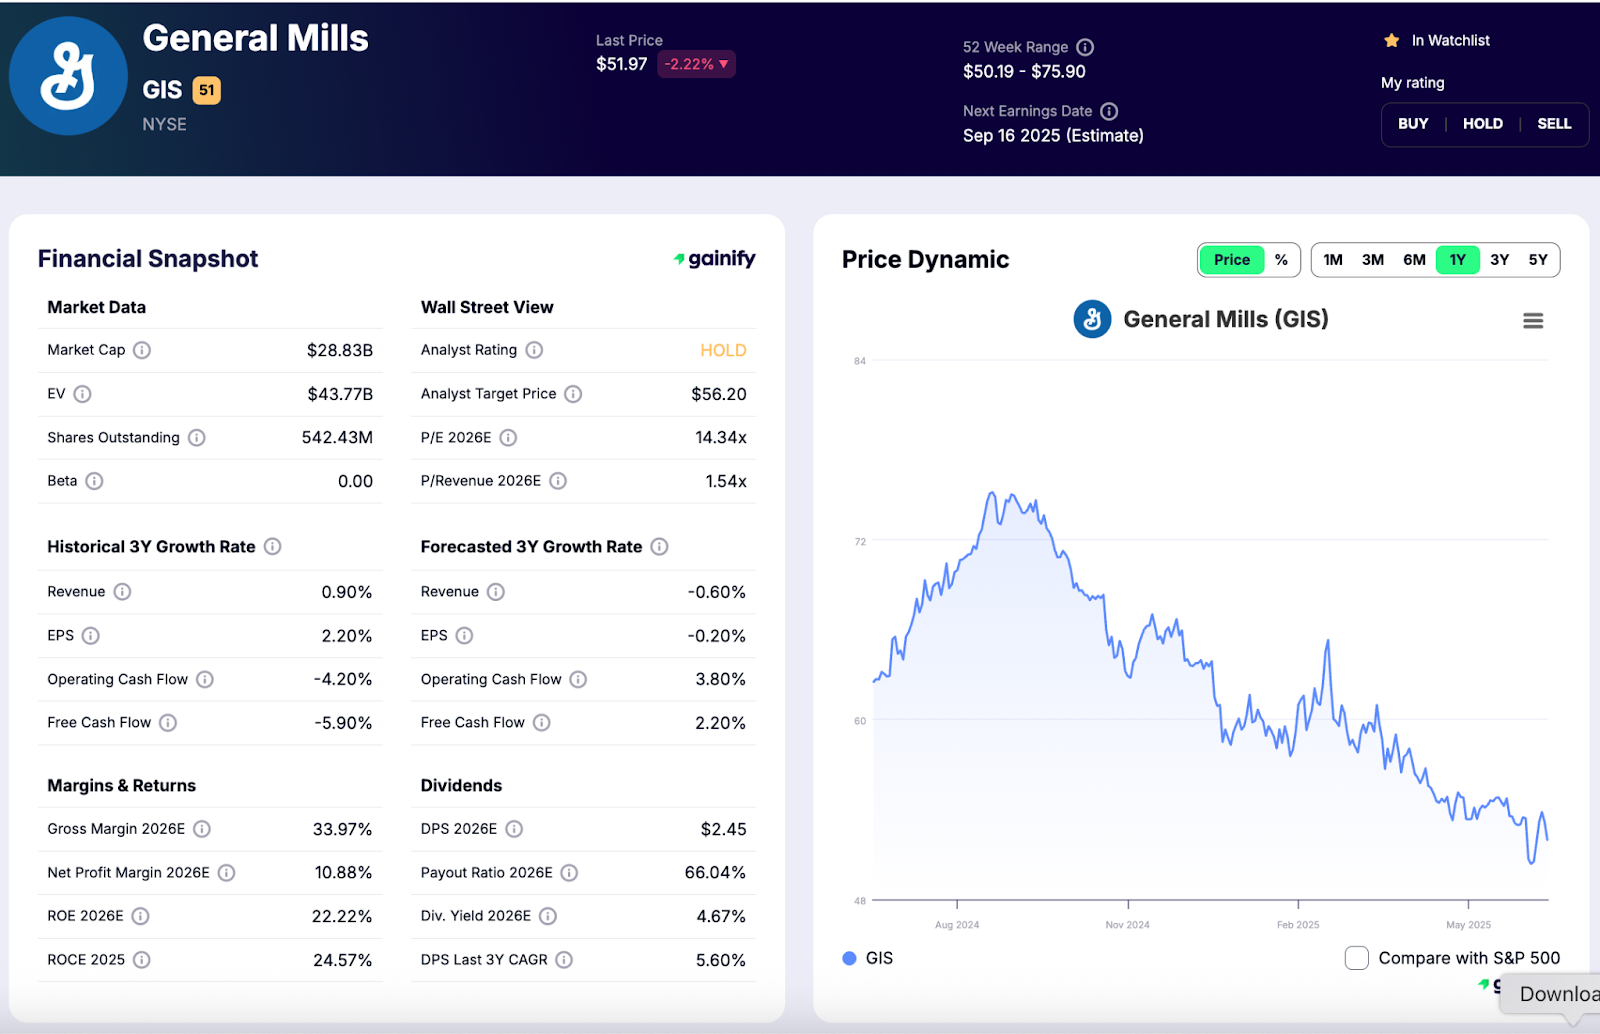
- General Mills Inc. (NYSE:GIS): General Mills, a prominent food producer, is estimated to have an ROE of 22.21% in 2025. This consistent ROE reflects its dependable revenue streams and effective management in the resilient consumer staples sector.
- Tyson Foods Inc. (NYSE:TSN): Tyson Foods, a major meat producer, showed an ROE of 4.38% in 2024. While lower than some other examples, this still reflects its ability to generate returns on equity in a capital-intensive industry that faces various input costs and market fluctuations.
- CrowdStrike Holdings Inc. (NASDAQ:CRWD): A leader in cloud-based endpoint protection, CrowdStrike had an ROE of 25.47% in 2026 (estimated). This indicates strong profitability and efficient use of equity in the rapidly growing cybersecurity software sector.
These examples showcase the diverse ROE figures across different industries and business models, emphasizing that ROE should always be evaluated within its proper context.
Conclusion: The Role of ROE in Disciplined Investing
Return on Equity (ROE) remains a fundamental and widely scrutinized metric in modern financial analysis. It condenses complex financial performance into a clear, per-share figure, reflecting a company’s capability to generate profits for its shareholders. Whether utilized for valuation, profitability assessment, or performance benchmarking, ROE is deeply integrated into robust fundamental investing frameworks.
However, a truly insightful analysis goes beyond looking at ROE in isolation. It necessitates a broader perspective, encompassing the company’s capital structure, cash flow quality, and management’s approach to accounting adjustments. Distinguishing between GAAP and non-GAAP earnings, and understanding the nuances behind dilution and accounting assumptions, is vital for deriving meaningful insights.
Ultimately, consistent and quality-driven growth in ROE signals not merely earnings momentum, but long-term resilience and disciplined financial stewardship. By understanding and properly applying ROE, investors can make more confident, data-driven decisions on their path to building enduring wealth.
FAQs About Return on Equity (ROE)
Q: Is a high ROE always a good sign for investors?
A: A high ROE generally indicates efficient profit generation from shareholder capital. However, it is not always good in isolation. A high ROE could be artificially inflated by high levels of debt, which increases financial risk. It is important to examine the company’s debt-to-equity ratio and other financial health metrics alongside ROE to ensure the high return is sustainable and not masking underlying problems.
Q: How does debt affect a company’s ROE?
A: Debt can magnify ROE. If a company uses more debt financing (leverage) relative to equity, its shareholders’ equity decreases. This smaller denominator can result in a higher ROE, even if the company’s net income does not significantly increase. This effect is known as financial leverage. While leverage can boost returns, it also increases financial risk.
Q: What is considered a “good” ROE percentage?
A: There is no universal “good” ROE percentage. What is considered strong depends heavily on the industry. Capital-intensive industries, like manufacturing or utilities, might naturally have lower ROE percentages compared to asset-light businesses, like software companies, due to different asset bases and cost structures. It is always best to compare a company’s ROE to its industry peers and its own historical average to assess its performance effectively.
Q: Where can I find a company’s ROE?
A: You can find a company’s ROE on its income statement and balance sheet, as it is calculated using figures from both. Many financial data platforms, such as Gainify, also provide pre-calculated ROE figures and allow for comparisons with industry benchmarks and historical data.
Q: Is ROE more important than Earnings Per Share (EPS)?
A: Both ROE and Earnings Per Share (EPS) are important, but they provide different insights. EPS tells you the portion of a company’s profit allocated to each outstanding share, which is foundational for valuation ratios like the P/E ratio. ROE, conversely, measures how efficiently a company uses the equity capital provided by shareholders to generate profit. They offer complementary perspectives, and together, they provide a more comprehensive view of a company’s financial performance.