
The Price-to-Book (P/B) ratio is among the simplest valuation ratios that can be used when assessing the fairness of a stock price. It assists investors in knowing the market value of a company in relation to the net worth of the assets of the company. Simply put, the P/B ratio indicates: The value of what you are paying a company today compared to the value of what it owns after all the debts are subtracted.
The P/B ratio is popular among novice and expert investors because it is simple to compute and understand. It provides a fast method of determining whether a stock can be undervalued, fairly valued or even overvalued depending on its balance sheet strength.
The P/B ratio is helpful to both small investors and professionals as it is easy to compute and, in most cases, it shows whether the stock is cheap or costly when compared to its balance sheet. However, it is limited like any other tool.
In this guide, you can find out how to calculate P/B, how to use it in a reasonable manner, when it has an advantage (and when it does not), and you should compare companies in the correct manner.
Key Takeaways:
1. The P/B ratio is used to make a quick assessment of whether a stock is underpriced or overpriced, depending on the net asset value of the company.
It measures the market price against the value of assets less liabilities and is therefore particularly helpful in asset-intensive sectors such as banking, real estate and utilities.
2. P/B is most effective when it is combined with other measures- particularly return on equity (ROE).
The high P/B ratio can only be justified in cases where a company is able to produce high returns. Low P/B may be an indicator of underpricing, yet it may also be a sign of more serious financial issues.
3. P/B ratio does not fit all companies, especially those that are intangible-driven.
Technology, software, media, and service firms tend to look costly on P/B due to the lack of brand strength, intellectual property, and earning potential in the book value.
What Is the Price-to-Book Ratio
Price-to-Book Ratio is a comparison of the market value of a company to the book value, which is the value of the net assets of the company on the balance sheet.
Formula:
P/B Ratio = Market Price per Share / Book Value per Share
- Market price per share is the current trading price of one share on the stock market.
- Book value per share represents the net asset value of the company on a per-share basis. The formula is as follows:
Book Value per Share = (Total Assets – Total Liabilities) ÷ Number of Outstanding Shares
What it indicates:
- P/B below 1 shows potential undervaluation or trouble. A P/B ratio of less than 1 will generally indicate that the market is undervaluing the company by a margin of less than the value of its net assets. This might appear as a purchasing opportunity on the surface. But the old-time investors understand it may also signify: Weak earnings, Poor asset quality, High debt, and Operational or strategic problems. Low P/B should be a cause for further examination rather than blind optimism.
- P/B 1-3 Fair Value of most stable companies. A P/B ratio of 1 to 3 is normal in the case of mature and stable businesses. This range suggests: A healthy balance sheet, steady profitability, and reasonable market expectations. It is typical in those industries where the earnings increase consistently, and the asset values are highly reflective of the economic reality.
- P/B above 3 shows Strong Profitability or Expected Growth. At a P/B ratio of above 3, the market is generally pricing in: High return on equity (ROE), strong future growth, valuable brands or intellectual property, and excellent competitive advantages. A high P/B does not necessarily raise a red flag. This premium is normal in companies that have outstanding business models, i.e. high-margin brands, category leaders, or firms with high pricing power. It is the question of whether the valuation is justified by the actual performance of the company.
Understanding Book Value
- Book value is not the true value.
- Book value is more dependable with tangible assets; intangible assets, such as brands or patents, are normally omitted.
- P/B ratios are best in asset-intensive industries and not in tech, software and service firms.
True value of the company is not the book value. It is an accounting figure that is subject to numerous influences. The book value is constructed out of the assets that a company possesses, including buildings, equipment, factories, and inventory, and then subtracted by its cash and investment holdings and all liabilities, such as debt, payables, and lease obligations.
Hypothetically, it is what would remain to shareholders in the event that the company sells all the assets and settles all debts. Nevertheless, book value does not necessarily reflect the true value. Old equipment can be sold at extremely low prices due to depreciation over the years, yet they are still useful. Real estate can be listed in the books at the time of purchase and that price might be a lot lower than the current market value.
Conversely, brand strength, patents, software, and customer loyalty which are some of the most valuable aspects of a business do not always manifest themselves in book value at all. Even the inventory manipulations can manipulate the numbers, depending on whether they are written down or marked up.
It is due to these reasons that P/B is most dependable in sectors where physical assets contribute significantly to value, like banking, manufacturing, and utilities since the book value in these sectors is more indicative of the actual economic value.
When P/B Ratio Works Best
Price-to-Book (P/B) ratio is most appropriate in companies that have large tangible assets. The book value is close to the underlying economic value in such instances and P/B can give a useful indication of whether a stock is underpriced or overpriced.
Industries P/B is most reliable:
- Banks have a significant amount of tangible assets consisting of cash reserves, loans, and financial securities. Their books are open and the book value is a good measure of financial health. Analysts tend to filter with P/B to filter undervalued banks or risk assessment in a down turn economy.
- Insurance Companies hold huge portfolios of investment assets to meet future liabilities. These are quantifiable and comparatively fixed assets and therefore P/B gives a realistic picture of the net worth of the company.
- Real estate firms hold land, buildings, and other properties which are recorded at cost or appraised values. P/B can point out whether the market is valuing these properties fairly in comparison with their balance sheet value.
- Energy Companies and Utilities possess large infrastructure including power plants, pipelines and distribution systems. Their valuation is dominated by tangible and long-lived assets, and P/B is a valuable measure to investors.
Industries P/B may be misleading:
- Technology and Software Companies whereby most of the value is based on intellectual property, algorithms, software, and customer ecosystems as opposed to physical assets. A technology firm can be overvalued with a very high P/B ratio, which in this case can be 10 or more. Book value does not reflect its actual economic value.
- Social Media and Internet Media as valuation is driven by the user bases, network effects, and brand recognition none of which is reflected in the balance sheet. P/B may significantly underprice the company.
- Education, Media, and Entertainment Companies as their value is comprised of content libraries, intellectual property, brand reputation, and creative talent. Physical assets are insignificant and P/B is not informative.
How to Calculate P/B the Analyst Way
Professional investors rarely rely on a single P/B ratio. They rather look at the long-term trends in five to ten years and look at the ratio and the return on equity (ROE) of the company. This will assist in separating between short-term market fluctuations and actual underpricing or overpricing. An illustration is that a bank that has been trading at a constant ratio of less than 1x P/B could be an indication of structural underpricing, whereas a temporary decline could be merely a result of market pessimism.
It is also important to compare P/B and ROE. A P/B that is approximately equal to ROE is fair valuation and a P/B that is greater than ROE may indicate a growth premium and a P/B that is less than ROE may indicate undervaluation in case fundamentals are good. The context is also important: such comparisons are to be made within the same industry and in comparison with historical standards. Through the integration of long-term P/B trends and ROE analysis, investors will be able to make more risk-adjusted decisions.
What Is a Good P/B Ratio?
The definition of a good P/B ratio is not universal, as it is determined by the industry of the company, its business model, and growth strategy. In the case of asset-intensive businesses such as banks, insurers, real estate companies, and utilities, P/B is directly related to physical assets, and the ratio is an effective measure of value. A P/B ratio of 1:3 in these industries is usually fair value and indicates that the market is valuing the company appropriately in relation to its net assets and earnings. A P/B of less than 1 could be a sign of underpricing, or a sign of financial distress, whereas a P/B of more than 3 could be an indication of high growth or profitability expectations on the part of investors.
In the case of asset-light or brand-driven firms, including technology firms, software companies, media and consumer brands, high P/B ratios are more typical since much of their value is in intangibles, such as brand equity, intellectual property, patents and customer loyalty. Even in such situations, a P/B of 10 and above may be justified provided the company has good profitability, predictable revenue growth, and competitive advantages. In the banking sector, the definition is more rigid: banks that have P/B below 1 are usually in distress, 1-1.5 is fair valuation, and only the best performers with high ROE are traded above 2. P/B of 3 is extremely uncommon and indicates outstanding performance.
When High P/B Ratio Is Good?
High P/B is not necessarily overvaluation. It is sometimes a true business strength.
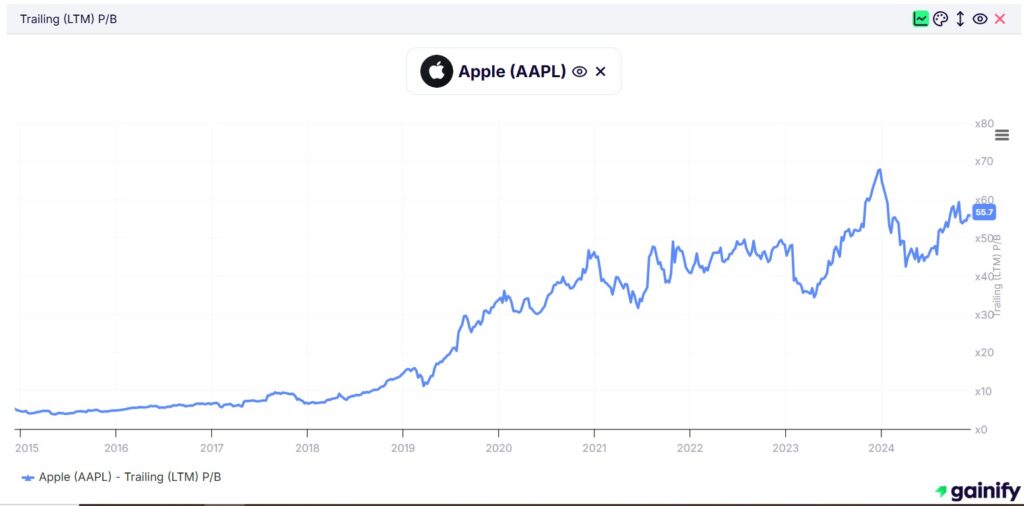
The P/B of Apple (NASDAQ:AAPL) is very high since its actual value is not the physical assets but the brand, ecosystem, and intellectual property. Investors are ready to pay a premium because its ROE is very high and cash generation is enormous, hence a high P/B indicates a high degree of confidence in the company.
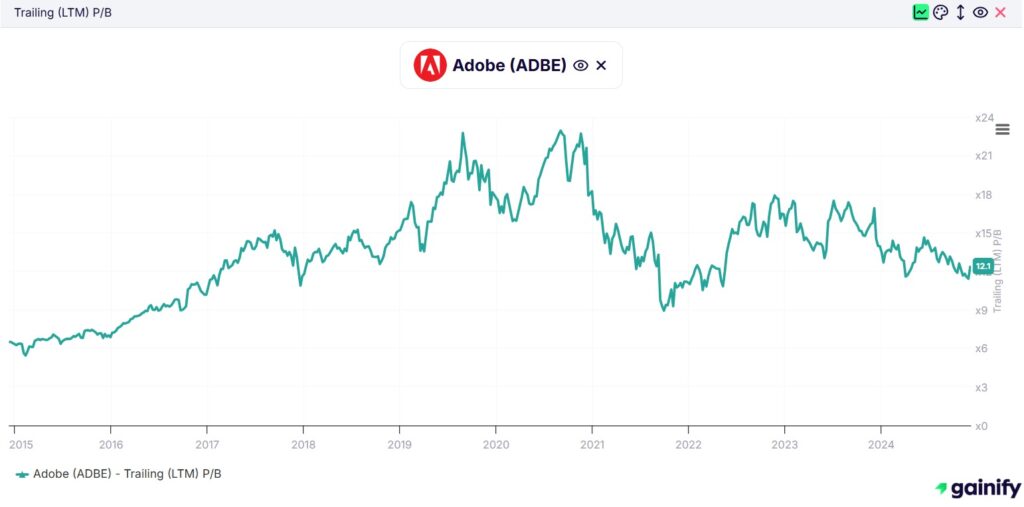
Adobe (NASDAQ:ADBE) is not a company whose value is based on tangibles. Its predictable revenue, high pricing power, and high margins are bound to push its P/B up. The market is willing to pay more since the business model of Adobe is stable and asset-light.
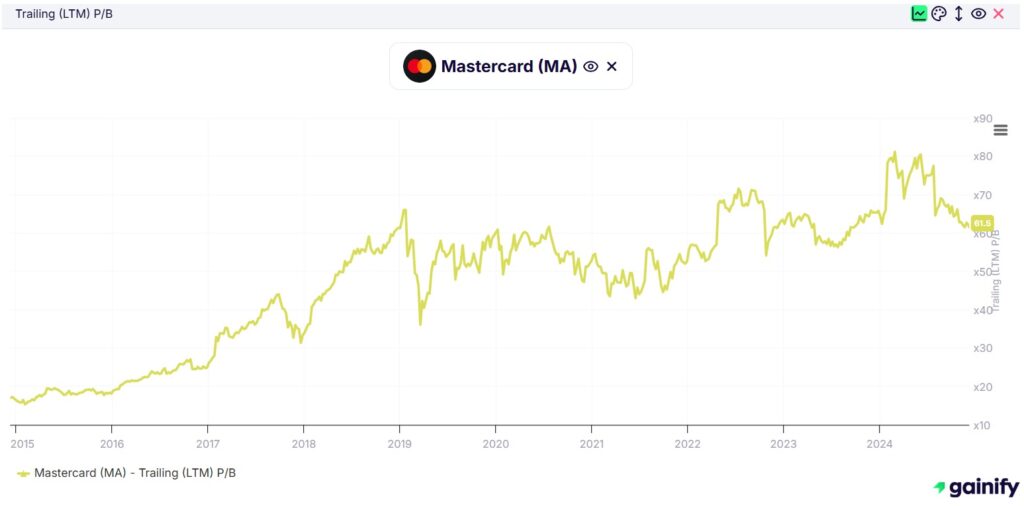
Mastercard (NYSE:MA) and Visa (NYSE:V) operate worldwide payment networks, which need very minimal physical investments, but produce very high margins. The reason why they have a high P/B is their network effects and highly competitive operations.
When Low P/B Ratio Is Good
Warren Buffett, who is a legendary value investor, tends to purchase businesses that are undervalued based on the book value, yet whose fundamentals are good.
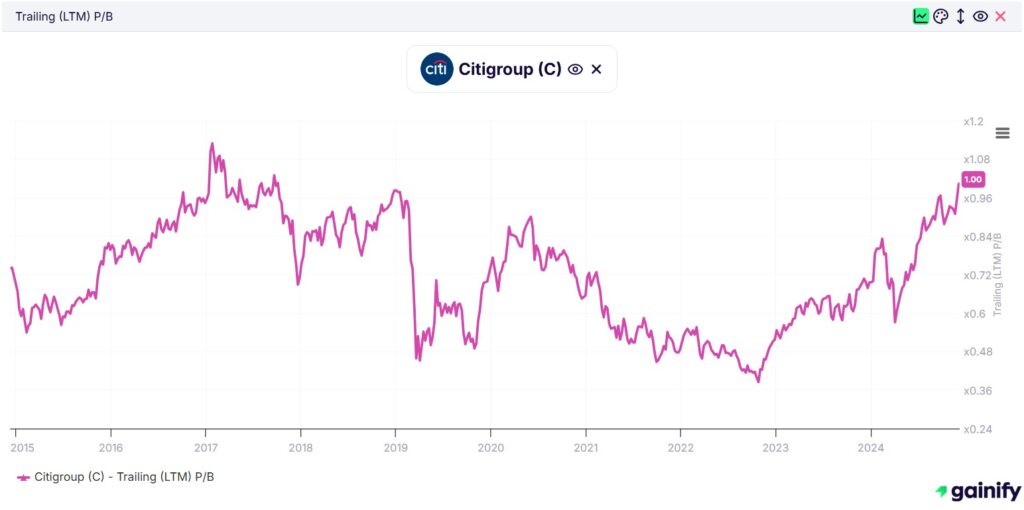
At times, Citigroup (NYSE:C) traded at a 0.6x P/B, driven by market concerns over credit quality and its below-average profitability. Nonetheless, the bank remained well-capitalized with a stable deposit base and traded at a material discount to peers. Such depressed multiples typically reflect short-term pessimism and create attractive long-term entry points.
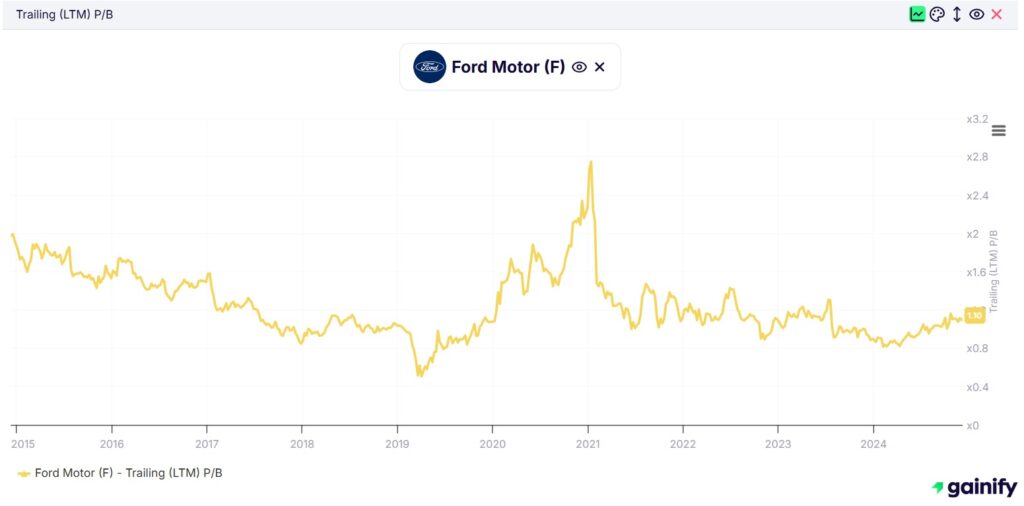
During recessions, companies like Ford (NYSE:F) or General Motors (NYSE:GM) often trade below book value, reflecting market overreaction to collapsing near-term demand. Yet their manufacturing assets and inventory retain meaningful value, enabling earnings recovery as conditions normalize. In this context, a depressed P/B typically signals cyclical undervaluation rather than structural impairment.
Real estate firms often hold land carried at historical cost, which can materially understate asset value. As a result, these companies may appear undervalued relative to their economic worth, with underlying land sometimes exceeding the firm’s market capitalization. In such cases, a sub-book valuation can indicate embedded, unrealized value.
When Low P/B Is a Warning
A low P/B ratio may also be a distressing indicator. It is not necessarily a bargain; in most instances, it is a material degradation of the underlying business. The falling revenue, negative ROE, high leverage, or the likelihood of significant asset write-downs are all indicators of structural problems and not mispricing. Other red flags are loss of market share, continued litigation, and continued operational or strategic mismanagement.
History provides many examples. Companies like Nokia, BlackBerry, Kodak, and Sears were trading at heavy discounts to book before their business models collapsed. Low P/B ratios in such instances were not opportunities, but correct indications of underlying deterioration.
P/B vs P/E
P/B and P/E are two popular methods of valuing a company, yet they are most effective in varying circumstances.
Price-to-Book is best applied to companies that are highly dependent on physical assets such as factories, machinery, or equipment. It is effective when the business is stable in terms of book value, leveraged to some extent and returns on equity (ROE) are consistent. In such situations, P/B can assist you in knowing how much investors are paying to the actual net assets of the company, which can tell a lot about its financial strength and future.
Price-to-Earnings is more appropriate in companies where earnings are more important than assets, such as tech, software, and service companies. These firms do not usually possess many physical assets and thus, book value is not very significant. Rather, P/E reflects the extent to which investors are prepared to pay the company the capacity to make profits.
The most effective solution, in fact, is to consider both. P/B and ROE can be used to demonstrate that the valuation of a company is justified by the returns generated by the company. This provides a better understanding of whether the stock is underpriced or overpriced.
P/B and ROE
P/B is always considered along with ROE (Return on Equity) by professional analysts. A high P/B is warranted when the company has a high return on equity. When P/B exceeds ROE, the stock could be overvalued. When P/B is less than ROE, the stock can be underpriced.
The company is generating a good 15% on its equity and the stock price is only slightly higher than the book value. This implies that investors are paying a reasonable price on the profits that the company is making. It looks reasonably valued.
In this case, the company is only making 5% on its equity yet the stock price is three times the book value. The high price that investors are paying is very low returns, and this is risky. This may be a sign of over-valuation or inability to grow profits.
How Investors Use P/B Ratio
- During bear markets investors seek stocks that are trading below book value and have good fundamentals.
- In the case of banking stocks, banks having P/B less than 1 are frequently indicated to be in distress.
- When P/B is below 1 and revenue is stable in the early stage, investors look at turnaround plays.
- To compare competition within the same industry e.g., two retail chains, P/B of one company is 1.2 and other company is 0.7. B can be underestimated in case both of them operate similarly.
- Screening undervalued stocks Value investors employ P/B screens to identify mispriced stocks.
Limitations of the P/B Ratio
P/B is helpful but it has its flaws. Technology and software firms tend to appear costly due to the absence of book value of valuable intangible assets, such as patents or software. Book value can be obsolete as assets can be reported at an old price, over-depreciated or not inflation-adjusted and depicts a misleading image. Liabilities may be understated when there is an unresolved lawsuit or off-balance-sheet liability that makes the company appear more valuable than it is. In the case of service firms that have limited physical assets, P/B may be inaccurate since the book value does not reflect the true earning capacity of the firm.
Combining P/B with Other Ratios
P/B is not a complete picture and therefore it is best to combine it with other ratios. ROE indicates the profitability of the company in relation to the equity. Debt-to-Equity ratio assists in evaluating financial risk and the amount of debt the company has. P/E ratio is the ratio of the stock price and earnings which provides an insight into the valuation in terms of profit.
The growth in earnings (CAGR) shows the long-term potential of the company. Interest coverage ratio indicates the ease with which the company can handle its debt. All these combined wills provide a better perspective of the actual value and risk of a stock.
Conclusion
One of the most effective and misconceived valuation ratios is the Price-to-Book (P/B) Ratio. When properly applied, particularly in the appropriate industries, it can be a very useful instrument of finding undervalued opportunities, rating banking stocks, rating tangible assets, and identifying a market mispricing. P/B however is best used when used in conjunction with ROE, debt analysis, growth expectations and industry comparisons.
Frequently Asked Questions About Price to Book Ratio
• Is higher or lower P/B ratio better?
It depends on the company. A low P/B shows financial distress or the undervaluation of the company. While a higher P/B means robust profitability or expected growth and in some cases the stock is overpriced.
• What does a negative P/B ratio mean?
If a company has a negative P/B its a red flag. it shows the company’s book value is negative. often due to the accumulated losses or high debt etc. this makes P/B not suitable for valuation.
• Can P/B ratio be used for all companies?
No. P/B works best for companies having physical assets such as banks, real estate, utilities and insurance companies.
• How often should P/B ratio be calculated?
P/B is often updated on a quarterly basis when the company releases its earnings report. But keen investors calculate it on a daily basis using the latest market price with most recent book value.
• What is price to tangible book value (PTBV)?
PTBV can be calculated as:
Stock price divided by tangible book value (book value minus intangible assets like goodwill and patents).
This shows a clear picture of what shareholders will receive in liquidation.
• Is P/B ratio better than P/E ratio?
Neither. P/B works best for the companies with physical assets while P/E is suitable for earnings and growth driven companies. Both have different applications.