

One of the quickest methods to assess the robustness of a business model is to understand the company’s balance sheet health. The Debt-to-Equity Ratio (D/E) is a fundamental indicator that a professional can use to evaluate the extent of leverage a firm is operating with and whether its capital structure is sustainable or concealing an increasing weakness.
This ratio indicates how the management funds the growth, the degree to which the firm is aggressive in using debt, and its ability to withstand the economic cycle changes.
It demonstrates the use of leverage as a disciplined growth driver or that the company is throwing off its balance sheet in some ways that may hurt it once the cash flow becomes constrained.
To new investors, understanding the D/E ratio is an instant advantage. It can make you look behind the headlines and see the actual risk profile of a company, it can make you see which companies have a sustainable financial base, and it can help you avoid those whose balance sheets appear sustainable until the next stress test.

Takeaways
D/E shows financial risk
The Debt to Equity ratio shows how heavily a company relies on debt versus shareholder capital. A high D/E signals elevated financial risk and greater leverage, while a low D/E reflects a stronger balance sheet and more stability. Investors use this metric to gauge a company’s resilience and its capacity to handle economic stress.
The stage of industry and growth is important.
Typical D/E levels vary by sector and by where a company is in its lifecycle. Early-stage businesses often operate with low leverage, growth companies may take on more debt to scale, and mature firms tend to prioritize balance sheet stability. Comparing D/E to industry peers provides a more accurate view of what constitutes normal leverage.
Cash flow is key
Debt is only manageable if a company generates reliable cash flow to cover interest and principal. Investors must also account for hidden leverage such as leases, supplier financing, and off-balance-sheet commitments. A high D/E ratio can be sustainable with strong cash flow, while even modest debt becomes risky when cash generation is weak.
What Is the Debt-to-Equity Ratio?
Debt-to-Equity Ratio informs you of the amount of debt a company owes per 1 dollar of shareholder equity.
However, more important than the definition is what this ratio tells us about the company strategy, stability and risk level.
Businesses require funds to operate, open more stores, acquire equipment, introduce new products or invest in technology. They acquire this money in two forms, Debt (loans, bonds, credit lines, lease liabilities) and Equity (shares issued + profits the company keeps). The D/E ratio indicates which of these sources the company relies more on.
A ratio of less than 1 indicates that the company is more financed through equity. A ratio of more than 1 implies that the company is more financed by debt. A ratio of more than 2 shows that the business is possibly over-leveraged. But once again, what is considered high or low is very much dependent on the industry.
Formula:
Debt-to-Equity Ratio = Total Debt / Total Equity
- Total Debt includes short-term and long-term debt.
- Total Equity includes share capital, retained earnings, and reserves.
Example:
If a company has:
- Total Debt = $500,000
- Total Equity = $1,000,000
Then:
D/E Ratio = 500,000 / 1,000,000 = 0.5
This implies that the company is leveraging 50 cents of debt to every 1 dollar of equity.
Why the Debt-to-Equity Ratio Matters
The Debt-to-Equity (D/E) ratio is important because it shows how much a company relies on borrowed money relative to the capital supplied by its shareholders. For a new investor, it is a quick way to assess whether a company may be taking on more financial risk than it can comfortably manage. In essence, the ratio compares what the company owes to what the owners have put into the business.
A high D/E ratio indicates heavy reliance on debt. This can be risky because increased borrowing leads to higher interest obligations, which reduce profits and limit the company’s ability to reinvest or respond to unexpected challenges. During economic slowdowns, companies with significant leverage feel pressure first since debt payments must continue even when revenue declines. For beginners, a high D/E ratio should prompt deeper analysis into why the company needs so much debt and whether it can service it safely.
A low D/E ratio suggests the company is financing most of its operations internally, which generally implies lower financial risk and greater resilience during tough periods. However, an extremely low D/E ratio is not automatically positive. Companies that avoid debt entirely may grow more slowly than competitors who use moderate, well-managed borrowing to fund expansion and improve returns.
There is no universally “correct” D/E ratio. What is considered high or low depends on the industry, the business model, and the company’s stage of growth. Some industries naturally use more debt, while others remain conservative. For new investors, the best approach is to compare a company’s D/E ratio with its industry peers and evaluate whether it generates sufficient and stable cash flow to comfortably service its obligations. This provides a clearer picture of the company’s financial strength and long-term sustainability.
How to Calculate the Debt-to-Equity Ratio (Step-by-Step)

Start with the balance sheet and add up all interest-bearing obligations. This includes short-term borrowings, the current portion of long-term debt, long-term loans, bonds, and capitalized lease liabilities. The goal is to capture the company’s true economic debt load, not just the items labeled “debt” in the financial statements.

Equity represents the shareholders’ residual claim on the business. It includes share capital, retained earnings, accumulated other comprehensive income, and reserves.
You can also compute equity using the basic balance-sheet identity:
Equity = Total Assets – Total Liabilities
This expresses the net value attributable to shareholders after all obligations are deducted.

D/E = Total Debt / Total Equity

A D/E ratio below 1 suggests that the company relies primarily on shareholder capital rather than borrowed funds. This generally points to lower financial risk because the business has fewer fixed obligations and greater flexibility to absorb slowdowns, invest in growth, or navigate unexpected shocks. Companies with low leverage often have more stable balance sheets and can endure periods of weak cash flow without facing significant financial strain.
When the D/E ratio is around 1, the company is using a balanced mix of debt and equity. This level of leverage is often intentional and strategic. It allows the business to benefit from the efficiency of debt financing while still maintaining a cushion of equity to support operations. Firms in this range typically manage leverage carefully, using debt to enhance returns without excessively magnifying risk.
A D/E ratio above 2 signals a materially higher level of financial risk. At this point, the company is heavily reliant on borrowed funds, which increases its sensitivity to cash flow volatility, interest-rate movements, and refinancing conditions. Even small disruptions in revenue or increases in borrowing costs can put pressure on profitability and liquidity. Highly leveraged firms must execute consistently and manage capital tightly, as there is far less room for error in their operations or financial planning.
What Counts as “Debt” in the D/E Ratio?
Many beginners are confused on what exactly constitutes debt in the calculation of the Debt-to-Equity ratio. It’s not just loans from a bank. Debt may appear in various forms on the balance sheet of a company and knowing them will enable you to determine the actual financial risk of the company.
Short-term debt encompasses anything that the company has to pay in a year. This normally includes items such as working-capital loans, which assist the company in running its day to day activities, bank overdrafts and other short term loans. These debts are normally minor in relation to long term loans, yet they may strain the cash of a company in case they are not handled appropriately.
Long-term debt refers to the funds that the company takes over a period of over one year. This may involve ordinary term loans, loans guaranteed by the government and which are charged at low interest rates, and corporate bonds issued to individuals or institutions. These debts are larger and remain on the company books over years hence they have a greater effect on the overall risk of the company.
Then there is the hidden debt, which most new investors fail to consider. These are commitments that do not appear as conventional loans but are considered as debt since the company will have to pay regularly. The largest one is lease liabilities. Shop, aircrafts, warehouses, or vehicles lease payments are often huge in retail stores, airlines, and logistics companies. Such leases are similar to long-term debt as they bind the company to make fixed payments over years. Other examples are supplier financing and deferred-payment purchase agreements, in which a company purchases goods today but pays them later under special financing agreements.
A firm can have very low bank loans and very high lease liabilities, which can radically alter the risk profile of the firm. When you just consider the loans and forget about these hidden debts, you might think that the company is safer than it is. To new investors, it is important to know all forms of debt so as to make a realistic judgment of financial strength.
What Is a Good Debt-to-Equity Ratio?
Rather than generic responses, the following is how analysts evaluate the ratio as being healthy or not.
Compare With Industry Averages
A “good” ratio depends entirely on the sector:
- Technology: Typically 0.1 to 0.6. The majority of tech firms are asset-light and use internal cash flow over debt financing, which makes them low-lever.
- Retail: The ratios are often 0.5 to 1.5 although the ratios may be significantly higher once the lease liabilities are added under current accounting regulations. Store leases are a significant burden to retailers and increase overall liabilities.
- Automotive & Manufacturing: Typically 1.5 to 3.0. These are capital intensive industries where there is a lot of investment in plants, equipment and inventory and therefore increased leverage is expected.
- Airlines: 3.0 to 5.0, and occasionally more, because the business is extremely asset-intensive. The leverage levels generated by aircraft purchases and lease obligations are much higher than most industries.
- Real Estate: Every 2.5 and more. Long-term leverage is used by developers and REITs to fund property portfolios and projects, which inherently leads to high D/E ratios.
- Banks and Financial Institutions: Ratios of D/E are typically high (8-12x or higher). This does not mean too much risk. Deposits are recorded as liabilities and regulatory capital ratios are much more applicable than D/E in determining the stability of banks.
Compare the D/E With the Company’s Cash Flow
The Debt to Equity ratio is only part of the story. A company can have a high D/E ratio and still be financially healthy or dangerously stretched depending on the strength and consistency of its cash flow. Cash flow reflects the actual cash a business generates from its operations and ultimately determines whether it can meet its obligations.
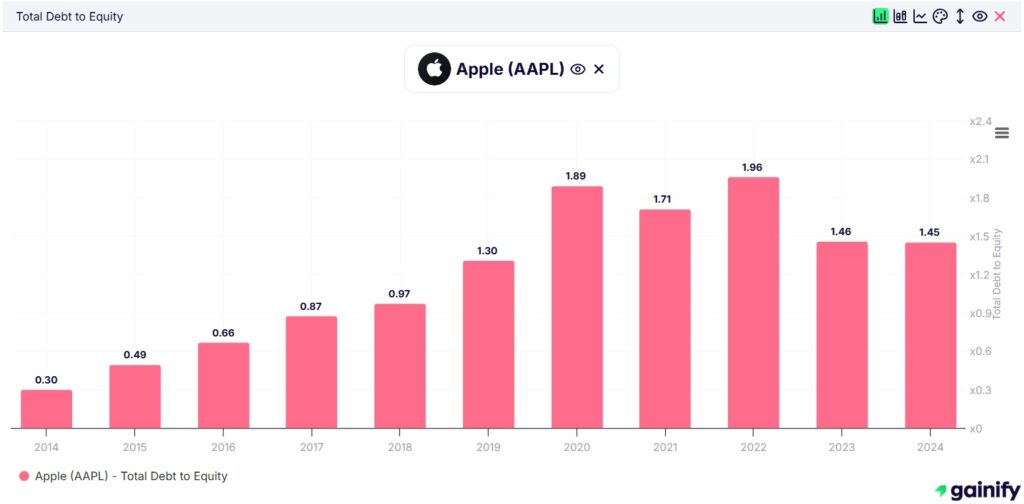
A company with substantial debt but strong, stable cash flow can comfortably handle interest payments and principal repayments. Large, mature firms such as Apple (NASDAQ:AAPL) and Microsoft (NASDAQ: MSFT) illustrate this dynamic. They carry meaningful levels of debt, yet their recurring cash generation is so robust that servicing these obligations is easily manageable. In situations like this, using debt can even be an efficient way to allocate capital.
The picture changes when a company combines high leverage with weak or volatile cash flow. In this case, the business may struggle to pay interest, reinvest in operations, or withstand cyclical downturns. This problem often affects early stage firms, companies in distressed sectors, or businesses exposed to sharp economic cycles. Here, a high D/E ratio is a clear warning sign.
For new investors, the key insight is that debt is only as safe as the cash flow that supports it. A high D/E ratio is never comfortable unless the company consistently generates enough cash to cover its obligations with room to spare. Evaluating leverage and cash flow together provides a much clearer picture of financial health than looking at the D/E ratio alone.
Assess the Company’s Stage of Growth
- A low D/E ratio is common in start-ups because they are primarily financed by equity (capital from founders or early investors) rather than debt. Young companies face unpredictable revenue, so taking on leverage too early can amplify risk and reduce financial flexibility. Borrowing before the business generates reliable cash flow can put the start-up under pressure if it cannot raise additional funds quickly.
- For growth-stage companies, the D/E ratio often rises as they scale and expand. They may use debt to finance new projects, hire talent, or enter new markets. For example, an e-commerce company building additional warehouses might rely on debt to accelerate expansion. Increasing leverage at this stage is common and can support faster growth, but the company must manage its borrowing carefully to avoid overextending itself.
- Mature companies typically have stable or gradually declining D/E ratios. Their focus shifts toward maintaining operational stability and returning capital to shareholders. A steady D/E ratio at this stage signals disciplined balance sheet management and the ability to service debt even during economic slowdowns.
How Analysts Interpret the D/E Ratio
Analysts do not focus solely on the number itself. They examine what is driving the D/E ratio and whether the underlying conditions justify it.
High D/E can be positive when the company is investing in productive assets such as new stores, plants, or technology, when the expected return on those investments exceeds the cost of borrowing, when the industry structurally supports higher leverage, or when debt is being used for long-term strategic expansion rather than to cover daily operating needs.
High D/E becomes a concern when debt is being used to plug operating losses, when cash flow is unstable, when interest rates are rising and increasing the cost of servicing debt, when the company must repeatedly refinance or roll over existing loans, or when the firm is stretching payables and relying heavily on short-term credit.
Low D/E can also signal issues. It may indicate overly conservative management, missed growth opportunities, or an excessive dependence on shareholder capital when prudent borrowing could improve returns.
Healthy companies do not avoid debt. They balance debt and equity to support growth while maintaining financial resilience.
When Is High Debt-to-Equity Good?
A high D/E ratio is not always a warning sign. It can be strategically advantageous when the borrowed capital is deployed productively and the company generates enough cash flow to service the debt.
Consider a retail chain that borrows to open new stores. If those stores historically generate a 25 percent annual return and the loan carries an 8 percent interest rate, the financing creates positive value. For example, a U.S. supermarket chain might take a 50 million dollar loan to build 15 new locations, each becoming profitable in the first year. In this scenario, debt accelerates market share gains and strengthens profitability, a form of growth-positive leverage.
Companies also benefit from using low interest rate environments to lock in long-term financing. For instance, a logistics company borrowing at 4 percent to purchase new delivery trucks can raise operating profits if the newer fleet reduces fuel and maintenance expenses. The debt enhances efficiency and supports long-term competitiveness.
Certain industries naturally operate with high leverage because of capital-intensive asset requirements. Airlines are a prime example. Aircraft are extremely expensive, so elevated D/E ratios are normal for the sector. Comparing these companies to tech firms with minimal asset needs would be misleading.
High D/E can also be appropriate when a business has stable, predictable revenue streams. An AI software firm with subscription-based income might take on a large loan to invest in infrastructure. Even with a high D/E ratio, the debt is manageable because cash inflows are recurring and reliable.
A high D/E ratio is favorable when debt is used to expand the business, returns exceed borrowing costs, and the company has the financial strength to manage its obligations. In these cases, leverage is not a risk but a powerful driver of growth.
When Is Low Debt-to-Equity a Problem?
A low D/E ratio may seem conservative and safe, but in many cases it signals missed opportunities, slower growth, or overly cautious leadership. Companies that avoid borrowing even when attractive opportunities exist may fall behind competitors that use debt strategically to scale and innovate.
For example, if a tech company with no debt chooses not to invest in cloud infrastructure despite strong market demand, it risks losing ground. Competitors that borrow prudently can expand faster, innovate more aggressively, and capture market share, leaving the “safe” company at a disadvantage.
Some businesses require outside capital to grow. Consider a successful restaurant chain in the United States that avoids taking on debt to open new locations. Meanwhile, a rival uses bank financing to expand aggressively and secures dominant market presence within two years. Excessive caution becomes a competitive liability.
Low D/E can also reflect management’s reluctance to use leverage even when the returns justify the investment. A manufacturing firm that refuses to finance new equipment may operate with outdated machinery, reducing efficiency and profitability. In such cases, fear of debt limits the company’s potential.
A persistently low D/E ratio may also suggest that the company is accumulating cash instead of deploying it into growth projects, acquisitions, or productivity improvements. Idle cash earns little and slows long-term value creation.
A low D/E ratio is not inherently positive. It can highlight underutilized capital, lack of ambition, or leadership that avoids strategic investment, ultimately limiting the company’s ability to deliver strong long-term returns for shareholders.
D/E Ratio vs Other Leverage Metrics
The D/E ratio itself is not able to present the complete picture of financial risk of a company. It is always used together with other leverage ratios that demonstrate the impact of debt on assets, equity and the payment capacity of the company in terms of interest.
- Net Debt to EBITDA is the primary solvency benchmark in credit markets because it links the company’s total debt burden to its operating profit. It highlights how durable the core earnings engine is and whether it can support the required debt service through different phases of the business cycle. Unlike D/E, it adjusts for cash balances, shifts in capital structure, and cyclical changes in profitability.
- Interest coverage ratios, often based on EBITDA or EBIT, provide a direct view of how easily a company can meet its interest obligations. These metrics reveal vulnerabilities that the D/E ratio may conceal. Low coverage indicates tight cash cushions, limited pricing power, margin compression risk, or sensitivity to rising interest rates. Coverage ratios are essential because they show whether the company can service its debt comfortably using operating profits.
- Net Debt to Free Cash Flow offers an even stricter solvency test. It measures how quickly a company can pay down debt using actual cash generation after capital expenditures and working capital needs. This helps distinguish companies with strong real cash flow from those that rely on accounting earnings.
Frequently Asked Questions About Debt-to-Equity Ratio
1. What does a debt-to-equity ratio of 1.5 mean?
D/E ratio of 1.5 implies that the company owes 1.5 times the amount of equity. That is, the company is borrowing at a rate higher than the amount invested by its owners. This implies moderate to high leverage, based on the industry. Investors need to examine whether the company can comfortably cover interest using its cash flow.
2. Is a D/E ratio of 0.5 good or bad?
A D/E ratio of 0.5 tends to show that the company relies more on its own funds than debt to fund its operations, which may imply reduced financial risk. But it is good or not depending on the industry. The D/E ratios of capital-intensive industries, such as airlines or utilities, are usually higher. It is always better to compare it with similar companies.
3. What does it mean if the debt-to-equity ratio is negative?
A negative D/E ratio is when the company has negative equity, that is, liabilities exceed assets. This is usually an indicator of financial distress or even insolvency. It can also be a sign that the company has been incurring a long-term loss. Before investment, investors ought to enquire why.
4. Should I include accounts payable in the debt calculation?
Accounts payable are usually not counted in the debt calculations since they are short term liabilities to suppliers and not loans with interest. But when the company treats it as a financed arrangement or it earns interest, it may be regarded as debt. It is always a good idea to check the financial notes of the company.
5. Do operating leases count as debt?
Yes, operating leases are now treated as financial obligations under modern accounting standards (IFRS 16 and ASC 842) and should be reported as debt. A large number of companies, particularly in the retail sector, airlines and logistics, have substantial lease obligations. These may have a drastic impact on the actual leverage of a company. Their omission can provide a false low D/E ratio.
6. What’s the difference between debt-to-equity and debt-to-assets?
Debt-to-equity is a ratio that compares the debt of a company to the equity of the shareholders, that is, the extent to which a company is funded by borrowing as compared to its own funds. Debt-to-assets is a ratio that compares the total debt to the total assets of the company, indicating the extent to which the company uses debt to finance its assets. Both provide an understanding of financial risk, but they emphasize different points of view. D/E is more of shareholder risk, whereas debt-to-assets is of total asset funding.
7. Why do banks have high D/E ratios?
The high D/E ratios of banks are natural since lending is their business. They take money borrowed by depositors and other sources and lend to customers, which results in high liabilities. Having a high D/E is typical of banks and does not imply that they are risky as other industries. Instead, investors need to pay attention to capital adequacy and regulatory ratios.
8. Can a debt-to-equity ratio be too low?
Yes, a very low D/E ratio may mean that the company is not taking any debt at all, which may restrict the growth opportunities. There are companies that can be too conservative and use only equity and fail to take opportunities to grow faster. The industry and stage of growth should be taken into account. Low D/E is not necessarily good when it retards business growth.
9. How do I reduce my company’s D/E ratio?
A company can use cash reserves or profits to pay off debt in order to lower the D/E ratio. The ratio is also reduced by increasing equity, e.g. through the issuance of shares or retention of earnings. Enhancing profitability without increasing debt is a way of ensuring a healthy balance. Basically, it is either a reduction of liabilities or an increase in the equity of shareholders.
10. Is D/E ratio the same for personal finances?
D/E ratio can be scaled to personal finance to gauge personal leverage, such as loans to net worth. Nevertheless, it is not quite the same since personal finances do not possess the equity of shareholders. It can still be used to determine whether one is borrowing excessively relative to his or her resources. It is a handy instrument of personal financial risk.
11. What D/E ratio will make lenders reject my loan application?
TNo single cutoff number fits all cases. Lenders look at the industry, cash flow of the company and its financial health. A high D/E can be accepted by some lenders in case the company has a stable cash flow and assets. Low D/E does not necessarily mean that it will be approved, lenders also consider profitability and other aspects.
12. Should startups focus on debt-to-equity ratio?
Startups tend to be more equity-based than debt-based, thus their D/E ratio is low. The reason is that they do not necessarily have a steady cash flow to finance borrowing. Startups ought to concentrate on expansion and revenue generation initially. D/E is more significant to monitor financial risk and funding strategies as they grow.
Conclusion
The Debt to Equity ratio is a simple but powerful tool for evaluating a company’s financial strength.
Understanding how much debt a business uses and how that debt compares to shareholder equity helps investors make more informed judgments about risk and stability.
However, the ratio is most meaningful when viewed in context, particularly by comparing companies within the same industry and by pairing D/E with other solvency and cash flow metrics.
No single number can capture the full picture. A holistic assessment that considers leverage, profitability, cash generation, and industry dynamics leads to far more reliable investment decisions.