
When you’re evaluating a business, especially in a volatile stock market, one of the most important questions to ask is: How much are you actually paying for the company’s ability to generate profits from its core operations?
That’s where EV/EBITDA becomes useful.
This ratio provides a clean, standardized way to compare the total value of a company to the earnings it produces before interest, taxes, depreciation, and amortization. In other words, it strips away the effects of financing choices and accounting differences to give a clearer picture of operating performance.
EV/EBITDA is widely used in corporate finance, especially by investment bankers, institutional investors, and equity research analysts. It is a valuable tool for comparing companies that operate in the same sector but have different levels of debt or capital intensity.
At its core, the formula is simple: EV/EBITDA = Enterprise Value divided by EBITDA
But using this metric effectively requires more than knowing the equation. To make well-informed investment decisions, you need to understand what each part of the ratio represents, how to calculate it accurately, and how to interpret the result within the context of industry norms, capital structure, and market expectations.
In the sections that follow, we’ll walk through each step, highlight practical examples, and explain how this metric fits into broader financial analysis.
What Is EV/EBITDA?
EV/EBITDA stands for Enterprise Value divided by Earnings Before Interest, Taxes, Depreciation, and Amortization. It’s a financial metric that allows for meaningful comparison between companies regardless of their differences in capital structure or tax jurisdictions.
Unlike the Price-to-Earnings (P/E) ratio, which is influenced by interest expenses, income taxes, and accounting methods, EV/EBITDA is viewed as a “debt-neutral” measure. It focuses solely on the operational earnings of a company, making it ideal for comparing companies across industries, particularly in capital-intensive or high-growth industries.
It’s also frequently used in valuing both public companies and private companies, especially in mergers, acquisitions, and investment strategy screens targeting profitable businesses or attractive acquisition targets.
Step 1: Calculate Enterprise Value (EV)
Enterprise Value (EV) represents the total value of a business to all stakeholders – not just equity holders. Think of it as the current theoretical cost to buy 100% of the company, including its debt obligations, while adjusting for its cash reserves.
The standard EV formula:
EV = Market Capitalization + Total Debt + Preferred Equity + Minority Interest – Cash & Cash Equivalents
Here’s how each component works:
- Market Capitalization: Price per share × shares outstanding
- Total Debt: Sum of all short-term and long-term debt shown on the financial statements
- Preferred Shares (Preferred Equity): Included because these rank ahead of common equity in liquidation
- Minority Interest (Non-controlling interests): Value of stakes in subsidiaries not fully owned by the parent company
- Cash & Cash Equivalents: Subtracted, as these are liquid assets that reduce net purchase price for a potential buyer
This valuation approach gives a more accurate representation of the company’s real market value, factoring in debt levels, cash levels, and preferred claims.
Step 2: Determine EBITDA
EBITDA stands for Earnings Before Interest, Taxes, Depreciation, and Amortization. It is widely accepted as a proxy for cash flow from core operations and helps isolate true operational performance from accounting anomalies, capital expenditures, or non-operating expenses.
EBITDA formula:
EBITDA = Operating Income (EBIT) + Depreciation + Amortization
You’ll find these values in the company’s income statement, balance sheet, or accompanying notes in the annual report.
Many analysts also make common adjustments to EBITDA for one-time expenses, amortization expenses, litigation expenses, or noncash expenses, to reflect sustainable core operating profitability. This adjusted version is often referred to as “Normalized EBITDA”.
Step 3: Divide EV by EBITDA
Now that you have the two inputs:
EV/EBITDA = Enterprise Value ÷ EBITDA
Example:
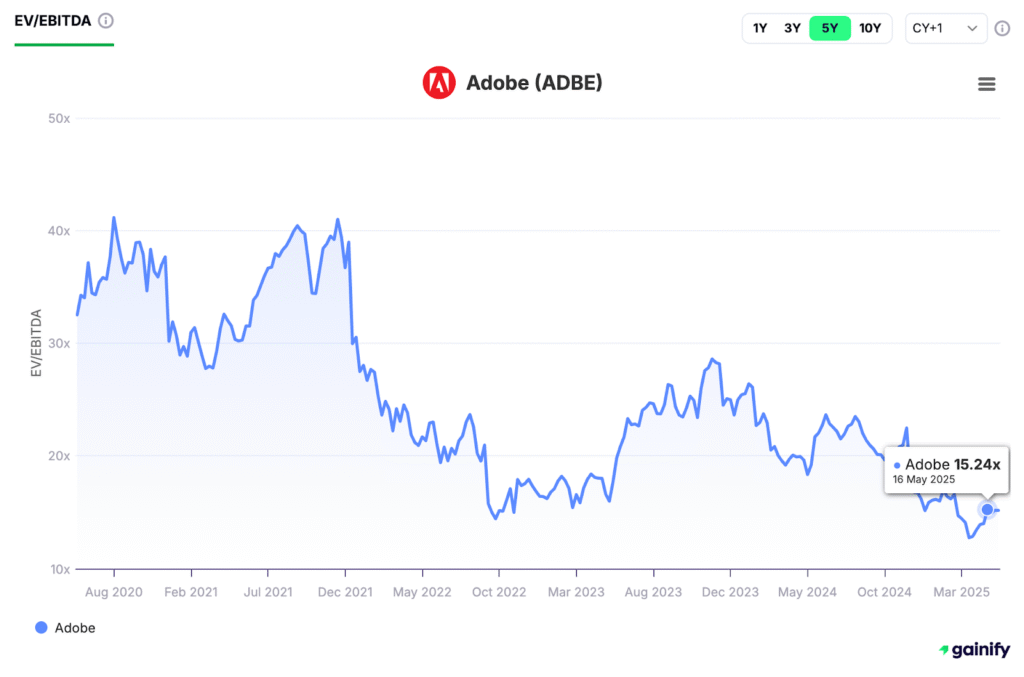
Let’s assume a company (for example: Adobe) has:
- EV = $176.0 billion
- EBITDA = $11.6 million
Then:
EV/EBITDA = 176 / 11.6 = 15.24x
This 15.24x multiple reflects what potential investors are paying for the company’s operating profits before any effects of debt financing, accounting practices, or income taxes.
Why Use EV/EBITDA?
EV/EBITDA is a valuable tool for evaluating financial performance across businesses of different sizes, sectors, and capital structures.
It works especially well for:
- Cross-industry comparisons
- Private business valuations
- Target company analysis in M&A
- Capital-intensive industries like energy, telecom, or manufacturing
- Retail businesses with varying operating expense loads
- Technology companies with large intangible assets or stock-based compensation
It’s also useful in discounted cash flow models as a terminal value sanity check.
What Is a Good EV/EBITDA Ratio?
There’s no universal “good” number. It depends on the industry average, growth potential, and market dynamics.
As a rough guide:
- 3x – 6x: Often considered undervalued or risky
- 6x – 10x: Typical for mature businesses with steady cash earnings
- 10x+: Reflects strong growth prospects or possibly overvaluation
Compare against:
- Historical average for the company
- Current market expectations
- Industry growth trends and market share changes
- Company-specific risk factors such as debt or exposure to economic factors
What to Watch Out For
Even though EV/EBITDA is a reliable valuation metric, it’s important to avoid common pitfalls:
- Mixing time periods (e.g. forward EBITDA with trailing EV)
- Overlooking non-operating assets like real estate
- Ignoring large future payments or pension liabilities
- Using it for financial institutions, where interest is a core business input
- Relying on it without reviewing other key metrics, like earnings per share, profit margins, and growth rates
EV/EBITDA should always be used alongside other financial measures to form a complete picture.
Final Thought
EV/EBITDA is not just a formula. It is a practical, real-world valuation technique used by experienced investors, acquirers, and finance professionals to assess investment opportunities. It combines simplicity with depth, offering a clearer view of how the market is valuing a company’s earnings capacity and future growth.
When used thoughtfully, with careful attention to industry benchmarks, company-specific drivers, and overall financial health, this ratio can highlight businesses with real profit potential. It can also help you identify cases where the stock price may be disconnected from fundamentals.
Mastering EV/EBITDA is an essential part of making informed and confident investment decisions in an increasingly complex financial landscape.
Frequently Asked Questions (EV/EBITDA)
Q: Why is EV/EBITDA preferred over the P/E ratio?
A: EV/EBITDA removes the effects of capital structure, tax rates, and non-cash accounting. This makes it more consistent when comparing companies, especially those with different financing methods or depreciation policies. The P/E ratio can be skewed by temporary accounting choices, while EV/EBITDA focuses on core operating performance.
Q: What is a good EV/EBITDA ratio?
A: There is no one-size-fits-all answer. A “good” ratio depends on the industry, growth profile, and market conditions. For example, stable businesses might trade at 6 to 10 times EBITDA, while high-growth companies may justify higher multiples. It is best to compare a company’s ratio to its peers and historical range.
Q: Can EV/EBITDA be negative?
A: Yes, if a company has negative EBITDA, the ratio becomes negative or meaningless. This often indicates the business is not yet profitable on an operational basis. In these cases, other valuation methods such as revenue multiples or discounted cash flow analysis may be more appropriate.
Q: Is EV/EBITDA useful for financial companies like banks?
A: No. EV/EBITDA is generally not used for banks, insurers, or other financial institutions because their business models rely heavily on interest income and leverage. For these sectors, metrics like price-to-book (P/B) and return on equity (ROE) are more informative.
Q: Where can I find EV and EBITDA data?
A: You can calculate EV from public financial statements using market cap, debt, and cash figures. EBITDA can often be found in earnings reports, investor presentations, or calculated from the income and cash flow statements. Financial data platforms like Finchat, Gainify, or professional tools such as Capital IQ and Bloomberg also provide these metrics.
Q: How is this metric used in real investment decisions?
A: Investors and analysts use EV/EBITDA to compare companies across sectors, evaluate takeover candidates, assess valuation against growth potential, and screen for undervalued stocks. It’s also a common input in relative valuation and used as a check in discounted cash flow models.