
Investors often debate whether the stock market performs better under Democrats or Republicans. Some focus on periods of strong GDP growth. Others point to factors like market volatility, tariff policies, or changes in leadership at the White House. But the more important question is simple: what do the numbers actually show?
When you analyze S&P 500 returns across different U.S. presidential terms, a more consistent story begins to emerge. The market does not move based on campaign slogans or political headlines. Instead, it reacts to deeper forces like corporate earnings, monetary & fiscal conditions, global events, and investor sentiment. While presidents help shape the policy environment, stock performance is usually driven by broader economic fundamentals.
This article looks at the average annual market returns under the last ten U.S. presidents, from George H. W. Bush to Donald Trump’s second term. The data includes periods of strong growth, sharp declines, and full recoveries. Most of these movements had more to do with economic cycles than with politics. This is a data-driven view of how markets have really responded across different presidential administrations.
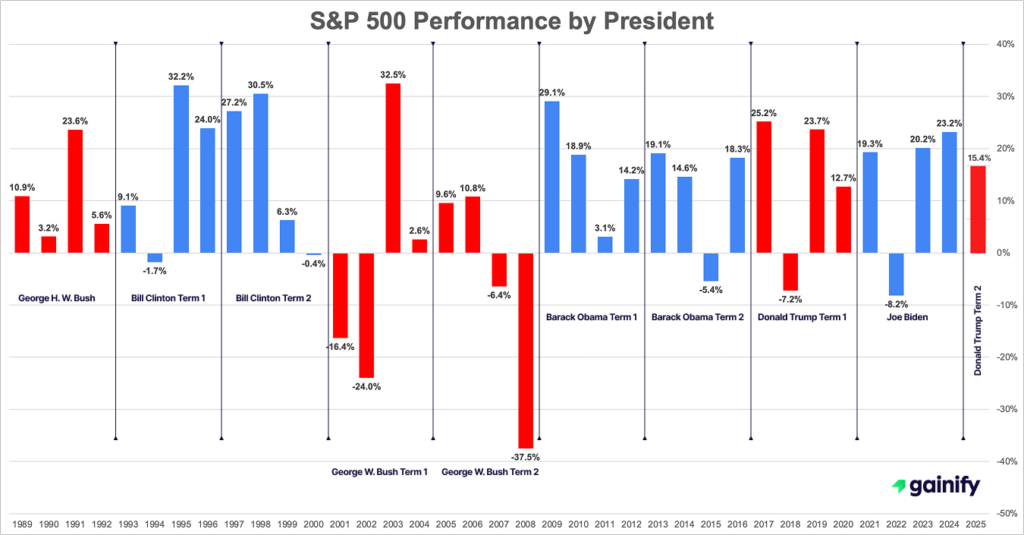
Stock Market Performance by President Term (S&P 500 Return)
President | Years | Avg Annual Return (%) |
Donald Trump (Term 2) | 2025-2028 | +15.4% (so far) |
Joe Biden | 2020-2024 | 13.63% |
Donald Trump (Term 1) | 2017-2020 | 13.59% |
Barack Obama (Term 2) | 2013-2016 | 11.64% |
Barack Obama (Term 1) | 2009-2012 | 16.31% |
George W. Bush (Term 2) | 2005-2008 | -5.89% |
George W. Bush (Term 1) | 2001-2004 | -1.31% |
Bill Clinton (Term 2) | 1997-2000 | 15.92% |
Bill Clinton (Term 1) | 1993-1996 | 15.87% |
George H. W. Bush | 1989-1992 | 10.82% |
Patterns Worth Noting
While headlines often link stock performance to presidential personalities, the data tells a more nuanced story. When we zoom out and look across the last 10 administrations, key trends emerge that reveal how markets actually behave and what really drives returns.
Bill Clinton’s presidency stands out at the top of the chart.
Across both terms, he delivered some of the strongest stock market returns in modern history. This era was fueled by the rise of growth stocks, rapid expansion of the internet economy, and a rare federal budget surplus. Market confidence soared as corporate earnings and innovation boomed.
George W. Bush presided over the weakest stock market returns.
His presidency was hit hard by the tech bubble collapse in the early 2000s and the financial crisis in 2008. These twin shocks severely damaged market capitalization and investor sentiment, making it a historically difficult time for equity performance.
Barack Obama oversaw a powerful market recovery.
His first term began at the bottom of the Great Recession. Thanks to coordinated quantitative easing, ultra-low interest rates, and corporate earnings recovery, both terms posted strong gains. The S&P 500 rebounded sharply, anchored by resilience in growth sectors and improving GDP growth.
Donald Trump’s first term delivered solid returns.
Markets rallied on tax cuts, deregulation, and a pro-business stance. But geopolitical tensions and global tariff announcements introduced pockets of volatility. Spikes in the Cboe Volatility Index and sharp reactions to trade policy headlines made 2018–2019 a turbulent stretch.
Trump’s second term has so far produced positive but uneven results.
Despite starting from elevated valuations and operating under tighter monetary policy, equities finished 2025 up 15.4%. Gains came alongside heightened volatility, as markets contended with renewed geopolitical tensions, trade uncertainty, and instability across key global supply chains. The environment has been more complex, but returns remained constructive.
Bottom Line:
It’s not about red or blue. It’s about timing, macro conditions, and policy response. The most consistent returns came during periods of economic expansion, innovation, and supportive central bank policy regardless of who occupied the White House. Investors should remember this when thinking long-term.
The Contrarian Take: It’s Not the President, It’s the Cycle
Blaming or crediting the stock market’s performance solely on who occupies the White House oversimplifies a far more complex system. While presidential policies can influence investor confidence, the true drivers of market behavior are rooted in macroeconomic forces and capital market dynamics.
To understand long-term equity returns, investors need to focus on the underlying cycles. These forces play a larger role than any single administration:
- Monetary policy set by the Federal Reserve directly influences interest rates, liquidity, and credit conditions. Shifts in policy affect valuations across all asset classes.
- Fiscal policy through government spending, stimulus programs, and tax policy can temporarily boost or dampen growth, depending on timing and structure.
- Trade policy and tariffs affect global supply chains and input costs. Escalating trade tensions or new tariff regimes can depress margins, especially in globally exposed sectors.
- Corporate earnings growth is the primary engine behind sustained stock market appreciation. Market prices ultimately follow the direction of profitability and earnings expectations.
- Market sentiment and positioning as measured by indicators like the Cboe Volatility Index, investor flows, and sector rotations offer insights into short-term risk appetite.
- Geopolitical risks including military conflicts, sanctions, and regional instability can trigger sharp risk-off reactions, impacting capital allocation and global demand.
Presidents can shape policy narratives and legislative priorities, but they operate within the broader framework of these cyclical forces. Election outcomes may affect short-term market moves, but investment results are far more sensitive to the stage of the economic cycle.
For investors, the lesson is clear. Focus on the data that moves markets: liquidity, earnings, valuations, and macro trends. The presidency matters, but the cycle dominates.
Investment Strategy Implications
If you’re managing capital with a long-term focus, the historical data provides clear takeaways for how to think about markets during presidential terms. The key lesson is to separate noise from signal and anchor your decisions in fundamentals.
- Avoid portfolio shifts based on election outcomes. Political cycles create headlines, but they rarely alter the structural path of long-term investment returns.
- Base your decisions on fundamentals. Prioritize valuation metrics, economic growth indicators, and earnings trends rather than political affiliation or campaign promises.
- Monitor sentiment and liquidity closely. During high-volatility periods, shifts in investor behavior and liquidity conditions can have a larger impact than policy changes.
- Use diversified tools to track macro regimes. Instruments like the Vanguard Mega Cap Growth ETF can offer exposure to high-quality names that perform well in both expansionary and tightening environments.
- Plan for cycles, not presidencies. Build your allocation strategy around business and credit cycles, recognizing that markets respond more to monetary and economic policy than to political agendas.
The data is clear: the best investment strategies are built on discipline, not prediction. Focus on what the market cares about – growth, cash flow, valuation, and risk – and stay consistent regardless of the political climate.
Final Thought
Presidents come and go. Markets move forward. While political leadership can influence short-term headlines, long-term investment results are driven by structural economic forces, not election outcomes.
The historical data is clear. The strongest returns come from understanding business cycles, earnings trends, and market fundamentals. Trying to predict stock performance based on party affiliation or presidential approval misses the real drivers behind asset prices.
If your goal is to outperform, focus on metrics that matter. Track earnings growth, liquidity conditions, market sentiment, and valuation multiples. These factors shape investor behavior and determine risk-adjusted returns over time.
Sustainable outperformance does not come from following political news. It comes from disciplined analysis and attention to the core financial signals that shape the market. That is where the real edge lives – in data, not in politics.
FAQ
Q: Do markets perform better under Democrats or Republicans?
A: Historically, returns have been slightly higher under Democrats, but the difference is more correlated with timing and macro cycles than policy.
Q: Should I change investment strategies during an election year?
A: No. Election year noise often distracts from the fundamentals. Stay focused on asset quality, cash flows, and risk exposure.
Q: How did tariff policies affect market volatility under Trump?
A: During Trump’s first term, tariff announcements led to sharp moves in the Dow Jones Industrial Average and broader S&P 500, though the market rebounded with strong earnings growth.
Q: What about Trump 2.0 performance in 2025?
A: WMarkets finished 2025 up 15.4%, a constructive outcome despite a challenging backdrop. Gains came amid elevated starting valuations, tight monetary policy, and renewed geopolitical and trade uncertainty. While volatility was higher and the path uneven, equity markets ultimately delivered solid returns, underscoring that macro conditions and policy mix mattered more than politics alone.