
In a market driven by sentiment and liquidity, short squeeze stocks often become the epicenter of volatility.
Investors betting against certain names can suddenly find themselves trapped when share prices start rising sharply, forcing a wave of short covering.
As of January 2026, several mid-cap and large-cap stocks are attracting unusually high levels of short interest.
Below, we break down the top 12 most shorted stocks and the key short interest metrics that traders watch to spot potential squeeze opportunities.
What is a Short Squeeze?
A short squeeze is one of the most explosive events in the stock market.
It happens when a heavily shorted stock suddenly surges in price, forcing short sellers to buy back the shares they borrowed in order to limit their losses. That rush to cover adds even more buying pressure, creating a powerful feedback loop where panic meets momentum.
In simple terms:
Shorts are trapped. Buyers take control. Prices skyrocket.
Short squeezes are usually short-lived but intense, with some stocks jumping 30%, 50%, or even 200% in just a few days.
Understanding the key metrics that signal a potential squeeze, such as short interest, days to cover, and cost to borrow, helps traders spot these setups before they take off.
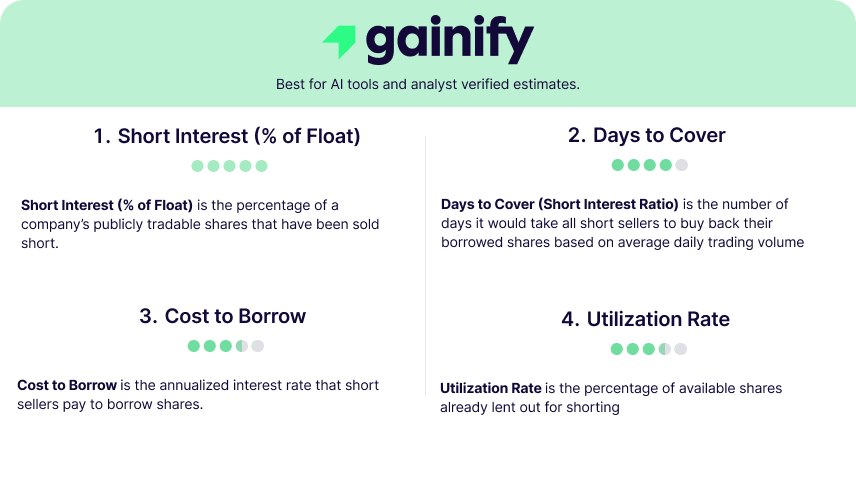
4 Key Metrics That Signal a Possible Short Squeeze
1. Short Interest (% of Float)
This measures the percentage of a company’s publicly tradable shares that have been sold short. A high percentage suggests strong bearish sentiment and a crowded trade.
- Under 10%: Low short interest
- 10–20%: Moderate
- Above 20%: Elevated and potentially volatile
2. Days to Cover
Also known as the short interest ratio, this figure shows how many days it would take short sellers to cover their positions based on average daily trading volume.
- Under 2 days: Easy to cover
- 2–5 days: Moderate pressure
- Above 5 days: High squeeze potential
3. Cost to Borrow
This represents the annualized interest rate that short sellers pay to borrow shares. When this rate climbs above 30% to 50%, it signals scarce share availability and intense competition to short the stock.
In other words, shorts are paying a steep premium to stay in the trade, which often is a sign that pressure is building and a potential squeeze could be near.
4. Utilization Rate
This shows the percentage of available shares already lent out for shorting.
- Below 50%: Plenty of shares available
- 70–90%: Tightening supply
- Above 90%: Very limited availability — most shares are already borrowed
A utilization rate near 100% suggests short sellers have maxed out available inventory, increasing the chance of a squeeze if demand shifts upward.
Top 20 Most Shorted Stocks as of January 2026
Based on short interest as a percentage of float, the following companies with a market cap of more than $10B currently rank among the most shorted in the market.
Rank | Ticker | Company | Market Cap | Short % of Float |
|---|---|---|---|---|
1 | LKNCY | Luckin Coffee | $79.38B | 39.88% |
2 | SMMT | Summit Therapeutics | $13.51B | 30.19% |
3 | CHTR | Charter Communications | $27.08B | 24.83% |
4 | H | Hyatt Hotels | $15.72B | 22.12% |
5 | QXO | QXO | $13.30B | 22.01% |
6 | MRNA | Moderna | $12.06B | 21.68% |
7 | W | Wayfair | $13.89B | 21.14% |
8 | GGAL | Grupo Financiero Galicia | $13.41B | 20.98% |
9 | SATS | EchoStar | $32.29B | 20.50% |
10 | IONQ | IonQ | $16.57B | 20.24% |
11 | SAIL | SailPoint | $10.64B | 20.04% |
12 | LITE | Lumentum | $27.38B | 19.83% |
13 | SMCI | Super Micro Computer | $18.48B | 19.71% |
14 | CrowdStrike | $39.53B | 19.34% | |
15 | MDGL | Madrigal Pharmaceuticals | $13.49B | 18.91% |
16 | GFS | GlobalFoundries | $20.49B | 18.38% |
17 | ASTS | AST SpaceMobile | $23.44B | 17.87% |
18 | ON | ON Semiconductor | $22.82B | 16.83% |
19 | RDDT | Reddit | $45.84B | 16.65% |
20 | BBIO | BridgeBio Pharma | $15.08B | 16.28% |
(Source: Market short interest data as of January 2026)
What These Stocks Have in Common
Most of these names share a few characteristics:
- High retail interest: Companies such as $HIMS and $W attract strong trading communities and social media buzz.
- Volatility: Stocks with smaller floats or recent news events tend to move sharply on limited volume.
- Mixed fundamentals: Some have inconsistent earnings or uncertain guidance, making them attractive to short sellers.
However, high short interest does not guarantee a squeeze. Catalysts such as earnings surprises, upgrades, or sudden momentum shifts are often required to trigger one.
Why Traders Care About Short Squeeze Stocks
Short squeeze setups create some of the most explosive and unpredictable moves in the market. Prices can soar not because fundamentals changed overnight, but because emotion, momentum, and forced buying collide all at once.
But there’s more to it than just the thrill of volatility.
For active traders:
Short squeeze metrics like days to cover and cost to borrow help spot early breakout setups before they hit the headlines. The payoff can be massive if timed right.
For long-term investors:
High short interest can act as a warning sign. It highlights stocks that are crowded, speculative, or sentiment-driven, and can swing violently in both directions.
In short, short squeezes reveal how sentiment shifts, how liquidity dries up, and how quickly conviction can turn into panic. Whether you trade them or avoid them, understanding short squeezes gives you a front-row view of market psychology in action.
Bottom Line
As of January 2026, short interest remains elevated across several large-cap stocks. Luckin Coffee ($LKNCY) and Summit Therapeutics ($SMMT) rank among the most heavily shorted names by short interest as a percentage of float, followed by Charter Communications ($CHTR) and Hyatt Hotels ($H), reflecting persistent investor skepticism across consumer, healthcare, and communications sectors.
These setups are a reminder that market sentiment can shift fast. A single catalyst (like strong earnings, guidance upgrades, or even social momentum) can turn a bearish consensus into a buying frenzy.
💬 For traders: High short interest means opportunity. Timing and risk control are everything.
💬 For investors: Elevated short activity is a caution flag. Volatility cuts both ways.
In the end, short squeezes are less about luck and more about understanding pressure points in the market. When conviction meets momentum, even the most overlooked stocks can become the week’s biggest story.