
Arbitrage is a trading strategy where profit is created at trade entry by buying an underpriced asset and simultaneously selling an overpriced equivalent, with returns driven by price convergence rather than market movement. In practical terms, arbitrage turns a temporary pricing inconsistency into realized P&L when the spread exceeds transaction costs and financing costs.
Arbitrage exists because market prices emerge from trading infrastructure. Differences in order books, fee structures, execution latency, liquidity depth, settlement cycles, and margin requirements generate short-lived price gaps even for instruments with identical cash flows.
Arbitrage has a market function beyond trader profit. Arbitrage capital reduces persistent mispricing and pushes identical cash flows toward a consistent price. Eugene F. Fama’s 1970 “Efficient Capital Markets: A Review of Theory and Empirical Work” formalized the idea that competitive trading removes easy, predictable profits, which is why long-lasting price gaps tend to disappear.
This article defines arbitrage in operational finance terms, explains the mechanisms that create arbitrage opportunities, details the execution workflow professionals use, and provides historically important examples across equities, ETFs, FX, and rates.
Arbitrage Explained: Key Points
- Arbitrage is a market-neutral trading strategy that captures profit from price differences between identical or economically equivalent assets through offsetting buy and sell positions.
- Arbitrage profit is locked at trade entry, meaning the spread must remain positive after transaction costs, financing costs, and settlement expenses.
- Arbitrage opportunities arise from market structure, including fragmented exchanges, liquidity imbalances, funding constraints, and differences in execution speed.
- Arbitrage improves price efficiency, because trading against mispricing reduces persistent price gaps and aligns equivalent cash flows across markets.
What Is Arbitrage in Practical Trading Terms?
Arbitrage in practical trading terms is a hedged trade where an expected profit is created at entry by capturing a price spread between equivalent payoffs. The realized outcome depends on whether that spread converges within the available funding and liquidity horizon.
A trade qualifies as arbitrage only when both legs produce the same economic outcome after adjusting for carry, financing, and contract terms. Traders establish this by mapping each leg to the same cash flows. If the payoffs differ, the position carries directional exposure and no longer qualifies as arbitrage.
This definition separates arbitrage from relative value trading. Relative value trades compare prices but still depend on changes in interest rates, volatility, or market trends. Arbitrage removes those dependencies by design. Once the hedge is in place, execution quality, cost control, and convergence timing become the primary drivers of results.
Arbitrage activity follows two clear structures:
- Same-asset arbitrage: the identical security trades at different prices on separate venues. The hedge is structural because the asset is the same. Risk concentrates in execution speed, fees, and slippage.
- Equivalent-asset arbitrage: two different instruments replicate the same payoff within defined limits. Examples include spot and futures, an ETF and its creation basket, or a cash bond and its futures contract. Risk concentrates in model assumptions, financing terms, and convergence timing.
Costs define viability. A quoted spread has no economic meaning if it disappears after costs. A complete arbitrage cost model includes bid–ask spreads, exchange fees, market impact, borrow or repo rates, margin interest, settlement penalties, and hedge rebalancing costs.
How Arbitrage Works
Professional arbitrage follows a clear and repeatable process. It starts by identifying two instruments that represent the same economic outcome and ends with a hedged position that earns money if the price difference between them narrows.
The first step is defining the pricing relationship that links the two instruments. This relationship explains how prices should line up under normal conditions. Common examples include the relationship between spot prices and futures prices, an ETF’s market price and the value of its underlying holdings, FX spot and forward rates, or call and put option prices. When the actual market prices move away from this relationship, an arbitrage opportunity appears.
The next step is checking whether the opportunity survives real-world costs. Traders calculate the price difference after including all costs and financing. A usable arbitrage spread must remain positive after accounting for.
- Bid–ask spreads on both sides of the trade.
- Exchange and clearing fees.
- Market impact from trading size.
- Borrow availability and borrow cost for short positions.
- Repo rates and haircuts for funded long positions.
- Margin interest and margin requirements.
- Ongoing hedge adjustment costs if the hedge changes over time.
Execution then becomes the main challenge. The goal is to complete both sides of the trade without being exposed in between. Risk arises when one side fills and the other does not. In fast-moving markets, this execution risk can overwhelm the expected profit. Firms reduce this risk using specialized order types, smart routing, internal crossing, and coordinated execution systems.
The final consideration is funding and holding power. A trade that looks profitable on paper can still lose money if the trader cannot hold it long enough. Funding terms can change, margins can rise, or capital can be withdrawn before prices converge. Recent research in Arbitrage with Financial Constraints and Market Power (2024) shows that financial constraints such as margin requirements, value-at-risk limits, and leverage caps can limit arbitrage capital and reduce liquidity, preventing traders from fully exploiting mispricing even when prices later converge. These constraints can restrict funding availability and force position exits at losses before price differences close.
This execution-focused view becomes clearer when each asset class is analyzed with its own pricing relationship, cost structure, and risk profile. The next section applies this framework to real arbitrage examples using concrete numbers and historical cases.
Why Arbitrage Opportunities Exist
Arbitrage opportunities form when the same economic payoff is priced through different trading and funding mechanisms. These price differences do not appear randomly. They are produced by market structure.
Several structural factors consistently generate arbitrage opportunities.
- Fragmented liquidity: the same instrument trades across multiple exchanges and trading systems. Differences in order book depth, queue priority, tick size, and maker–taker fee models lead to temporary price differences. Recent market microstructure research, including studies by Thierry Foucault and co-authors at HEC Paris after 2015, shows that fragmentation increases short-term price dispersion even in highly liquid markets.
- Inventory and balance sheet constraints: dealers and market makers adjust prices based on inventory exposure, capital usage, and funding cost. When balance sheet capacity tightens, quotes move away from theoretical parity. Research following the Global Financial Crisis, including work by Darrell Duffie at Stanford, documents how dealer balance sheet limits reduce arbitrage activity and allow pricing gaps to persist longer than models predict.
- Settlement and collateral mechanics: different instruments settle on different timelines and require different collateral. These differences change the cost of holding long or short positions over short horizons. Studies by the Bank for International Settlements after 2018 show that margin requirements and collateral availability directly affect relative pricing, especially during volatility spikes.
- Participation constraints: not all investors can trade all instruments. Regulatory rules, mandates, and operational limits restrict access. As reported in post-crisis research on segmented markets, these constraints split demand and supply across instruments that represent similar payoffs, allowing price differences to emerge.
Historical evidence reinforces this structure-based view. When futures and options markets expanded in the late 1970s and 1980s, parity relationships such as spot–futures pricing became tradable at scale because hedging became cheaper and faster. This shift increased arbitrage activity, but it also changed competition. The advantage moved from identifying mispricing to executing trades efficiently with low costs and stable funding.
These structural conditions explain where arbitrage opportunities come from and why execution and funding matter as much as pricing. That connection leads directly into how professional arbitrage is executed in real trading workflows.
Examples of Arbitrage
Arbitrage examples are most useful when they clearly show three things: which payoffs are economically equivalent, how the trade is structured, and what the profit looks like after all costs and financing. Looking at concrete examples makes these elements easier to see in practice across different asset classes.
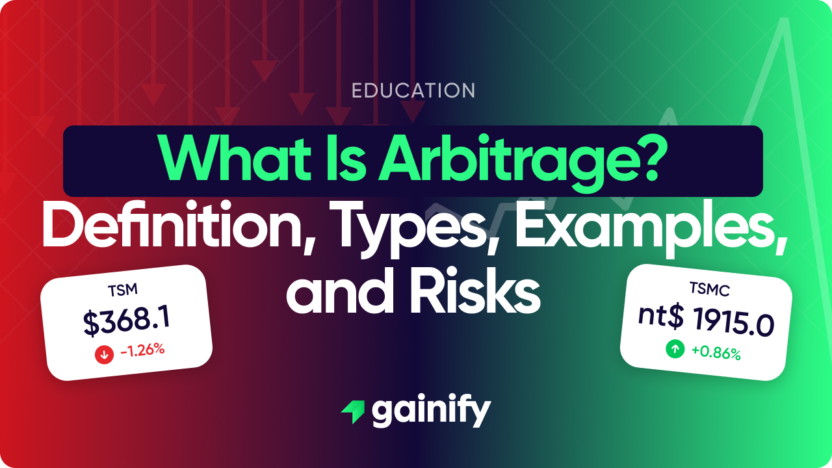
Same-asset arbitrage in equities across venues
Economic equivalence is straightforward in this case. One share of a listed company represents the same ownership claim regardless of where it trades, which makes the hedge structural.
A realistic microstructure example shows how this works in practice.
- Venue A quotes €100.00 bid and €100.02 ask.
- Venue B quotes €100.10 bid and €100.12 ask.
Buying at €100.02 on Venue A and selling at €100.10 on Venue B captures a gross spread of €0.08 per share. If combined fees and slippage amount to €0.05 per share, the net profit is €0.03 per share. On a position size of 300,000 shares, this results in a net profit of €9,000, assuming both legs execute fully.
In modern electronic markets, this type of opportunity disappears quickly. The lasting advantage is not identifying the price difference, but executing faster, routing orders efficiently, and minimizing transaction costs.
ETF creation and redemption arbitrage
Economic equivalence in ETF arbitrage comes from the creation and redemption mechanism. Authorized participants can exchange a predefined basket of underlying securities for ETF shares, or exchange ETF shares back for the basket. This process links the ETF’s market price to the value of its holdings, once execution costs and operational delays are taken into account.
Two pricing situations create arbitrage opportunities.
- When an ETF trades above the value of its underlying basket, the arbitrage trade involves selling the ETF and buying the basket. The arbitrageur can then create new ETF shares using the basket to cover the short position, or hold the trade until the ETF price converges toward the basket value.
- When an ETF trades below the value of its basket, the trade works in the opposite direction. The arbitrageur buys the ETF and sells the underlying basket, then redeems ETF shares for the basket or waits for prices to realign.
Price gaps persist because execution is neither instant nor frictionless. Basket trades involve multiple securities and higher transaction costs than single-instrument trades. Some constituents may be hard to borrow, increasing shorting costs. Index rebalances and corporate actions change basket composition over time. The creation and redemption process also introduces settlement delays and operational risk, which can prevent immediate convergence even when the pricing difference is visible.
Covered interest arbitrage and cross-currency basis
Economic equivalence in this case comes from covered interest parity. When currency risk is fully hedged using FX forwards or swaps, borrowing in one currency and lending in another should result in the same return implied by the forward exchange rate.
After the 2008 financial crisis, this relationship broke down for extended periods. Covered interest parity deviations persisted because bank balance sheet constraints, regulatory capital requirements, and collateral costs increased the cost of providing arbitrage capital. Research published in the BIS Quarterly Review in 2016 described the cross-currency basis as a structural funding effect rather than a temporary pricing error.
Further empirical analysis by Du, Tepper, and Verdelhan in their 2017 NBER study quantified this effect. They showed that the cross-currency basis measures the gap between direct dollar funding and synthetic dollar funding created through FX swaps. This gap widened when balance sheet costs rose and narrowed when funding conditions eased.
Treasury on-the-run vs off-the-run and basis trades
Economic equivalence in U.S. Treasuries appears straightforward because on-the-run and off-the-run bonds often have very similar maturities and cash flows. The pricing difference comes from liquidity. On-the-run Treasuries are the most recently issued securities and trade frequently with deep order books. Off-the-run Treasuries trade less actively and typically offer higher yields to compensate for lower liquidity and weaker collateral value.
These price differences persist because liquidity and financing matter in practice. On-the-run bonds are easier to finance in the repo market and are more attractive as collateral, which supports higher prices. Off-the-run bonds require more balance sheet usage and can be harder to fund, which pushes their prices lower even when cash flows are nearly identical.
In practice, traders often express these relative pricing differences through futures versus cash bond positions, commonly called Treasury basis trades. A typical structure involves buying a cash bond and selling a futures contract, or the opposite, depending on relative pricing. Profit depends on the gap between the bond and the futures contract narrowing over time.
These trades perform well when funding conditions are stable and liquidity is available. When repo rates rise, haircuts increase, or margins tighten, financing costs can overwhelm the expected convergence. Positions that appear well hedged can experience rapid losses if funding conditions change before prices realign.
Arbitrage Risks That Matter in Real Markets
Arbitrage risk is the set of conditions that prevents a locked spread from converting into realized profit within the available funding horizon and liquidity capacity. The most common arbitrage losses come from financing and forced exits, not from being “wrong about value.”
The main risks that determine outcomes are.
- Execution risk. Partial fills, slippage, and queue loss turn a theoretical spread into a realized negative spread.
- Funding liquidity risk. Borrow rates rise, repo haircuts increase, and margin requirements tighten. A position that required 10x leverage can become infeasible overnight.
- Market liquidity risk. Bid-ask spreads widen and depth disappears. Exiting becomes costly and slow, and spreads can widen further before converging.
- Model risk. The equivalence mapping is wrong or incomplete. Delivery options, tax effects, and embedded optionality can dominate the spread.
- Operational and settlement risk. Settlement fails, corporate actions, and processing delays create unhedged windows and penalty costs.
The interaction between funding liquidity and market liquidity is formalized in Brunnermeier and Pedersen’s 2009 “Market Liquidity and Funding Liquidity,” which models feedback loops where tighter funding reduces liquidity provision and can widen mispricing rather than close it.
This risk framework explains a core finance history point. Arbitrage becomes most dangerous when it looks most attractive on a spread basis because stress widens spreads and simultaneously weakens funding and liquidity. That risk-return structure connects directly to why arbitrage still improves markets even though it can fail for individual traders.
Why Arbitrage Is Important
Arbitrage is important because it enforces consistency in pricing for identical or equivalent cash flows. When arbitrage is active, it reduces the persistence of mispricing that would otherwise distort capital allocation and execution quality for all participants.
Arbitrage improves pricing through concrete mechanisms.
- Linking spot and derivative markets: arbitrage links spot and derivative markets through carry relationships, which tightens the connection between funding rates, dividend expectations, and futures pricing.
- Reducing short-term pricing errors: arbitrage reduces transitory pricing errors created by order-flow shocks, inventory constraints, and temporary liquidity gaps.
- Accelerating price discovery: arbitrage accelerates price discovery by pushing stale quotes toward levels implied by related markets.
These effects become clearer when arbitrage is separated from speculation and hedging. Arbitrage targets price alignment between equivalent payoffs, speculation depends on market direction, and hedging offsets existing exposure. Making this distinction helps investors identify true profit sources and understand the risks that cause arbitrage trades to fail.
Arbitrage vs Speculation vs Hedging
Arbitrage differs from speculation and hedging because arbitrage targets spread convergence between equivalent payoffs, speculation targets directional movement, and hedging reduces an existing exposure.
The differences become clear when framed as objective and P&L driver.
Attribute | Arbitrage | Speculation | Hedging |
Primary objective | Capture mispricing | Profit from price movement | Reduce existing risk |
P&L driver | Spread convergence | Directional move | Risk reduction, not profit |
Main failure mode | Funding or convergence delay | Forecast error | Hedge mismatch and carry cost |
Typical time horizon | Short to medium | Any | Matches exposure duration |
A trade becomes arbitrage only when payoff equivalence is defined and the hedge removes the dominant systematic exposures. Many “relative value” trades are partially hedged and still carry meaningful beta, duration, or volatility exposure.
That classification sets up a practical question. Many readers want to know when arbitrage opportunities disappear and who can realistically capture what remains.
When Arbitrage Opportunities Decline and Who Captures Them
Arbitrage opportunities decline when the net spread no longer compensates for execution costs, financing costs, and margin usage, or when the time required for convergence exceeds available funding capacity. This decline is driven by structural changes rather than by traders failing to identify pricing relationships.
The most common structural reasons for declining arbitrage opportunities are tighter connectivity between trading venues, stronger competition that compresses spreads, higher balance sheet and regulatory costs that raise financing expenses, and operational frictions that limit access to the cheapest instrument or the most efficient hedge. As these factors intensify, only spreads that compensate for higher costs and risks remain tradable.
Who captures the remaining opportunities depends on infrastructure and funding terms. High-speed market makers dominate microstructure arbitrage where execution speed and queue position determine profitability. Banks and large balance-sheet investors dominate basis trades where repo access, collateral efficiency, and margin treatment are critical. Specialized relative-value funds focus on multi-leg arbitrage where pricing models, contract features, and hedge management determine outcomes.
This progression reflects a consistent historical pattern. As markets become more electronic and competitive, simple arbitrage disappears. What remains are capital-intensive and structure-driven opportunities where funding, collateral, and settlement constraints prevent prices from fully converging.
Frequently Asked Questions About Arbitrage
What is arbitrage?
Arbitrage is a trading strategy that seeks to profit from price differences between identical or economically equivalent assets by entering offsetting positions. Returns depend on price convergence, not market direction.
Is arbitrage risk-free?
Arbitrage is not risk-free in practice. While market exposure is hedged, trades remain exposed to execution risk, transaction costs, funding availability, margin changes, liquidity conditions, and delays in convergence.
Why do arbitrage opportunities exist?
Arbitrage opportunities exist because markets are structurally segmented. Differences in liquidity, execution speed, funding costs, settlement rules, and participant access cause temporary pricing gaps between equivalent instruments.
Why do arbitrage opportunities disappear?
Arbitrage opportunities disappear as capital trades against them. Increased competition, faster execution, and tighter venue connectivity compress spreads until they no longer exceed total costs.
Who can execute arbitrage strategies effectively?
Most arbitrage strategies are executed by institutional participants. High-speed firms dominate microstructure arbitrage, banks and large funds dominate balance-sheet-intensive trades, and specialized hedge funds focus on multi-leg or model-driven arbitrage.
How is arbitrage different from speculation?
Arbitrage targets price alignment between equivalent payoffs and does not rely on directional price forecasts. Speculation depends on predicting price movements and carries directional risk.
How is arbitrage different from hedging?
Arbitrage seeks to generate profit from mispricing. Hedging seeks to reduce or eliminate an existing risk exposure. The objectives and risk profiles differ.
Does arbitrage still exist in electronic markets?
Arbitrage continues to exist, but simple price discrepancies close rapidly. Most remaining opportunities are tied to funding, collateral, settlement, or contract structure rather than obvious price errors.
What determines arbitrage profitability?
Profitability depends on execution quality, total transaction and financing costs, funding stability, margin requirements, and the ability to hold positions until convergence occurs. Spread size alone is not sufficient.