
Over the past five years, Chinese equities have significantly lagged behind their U.S. counterparts. The iShares MSCI China ETF (MCHI) has underperformed the S&P 500 ETF (VOO) by roughly 109%, reflecting years of regulatory crackdowns, slower growth, and geopolitical headwinds.
Yet 2025 is telling a different story. Year-to-date, MCHI is up 33.4%, far outpacing VOO’s 11.7% gain.
After years of underperformance, investors are asking whether this rebound signals a lasting recovery in Chinese stocks, especially for major U.S.-listed names like Alibaba (BABA), PDD Holdings (PDD), and NIO (NIO).
Below, we take a closer look at some of the largest Chinese companies by market capitalization that are currently listed on U.S. stock exchanges.
# | Company | Ticker | Industry | Last Price (USD) | Wall Street Target (USD) | Upside Potential |
1 | Alibaba Group Holding Ltd | BABA | Specialty Retail | 159.01 | 194.16 | +22.1% |
2 | PDD Holdings Inc | PDD | Specialty Retail | 124.27 | 144.18 | +16.0% |
3 | NetEase Inc | NTES | Gaming & Multimedia | 146.91 | 158.50 | +7.9% |
4 | JD.com Inc | JD | Specialty Retail | 31.85 | 44.92 | +41.0% |
5 | Baidu Inc | BIDU | Internet Information | 121.69 | 129.90 | +6.8% |
6 | Tencent Music Entertainment | TME | Music & Media | 22.43 | 28.32 | +26.3% |
7 | Li Auto Inc | LI | Auto Manufacturers | 22.80 | 28.88 | +26.7% |
8 | Futu Holdings Ltd | FUTU | Financial Services | 154.60 | 205.33 | +32.8% |
9 | KE Holdings Inc (Beike) | BEKE | Real Estate Services | 17.65 | 22.87 | +29.5% |
10 | XPeng Inc | XPEV | Auto Manufacturers | 21.02 | 26.48 | +26.0% |
11 | NIO Inc | NIO | Auto Manufacturers | 6.71 | 6.79 | +1.2% |
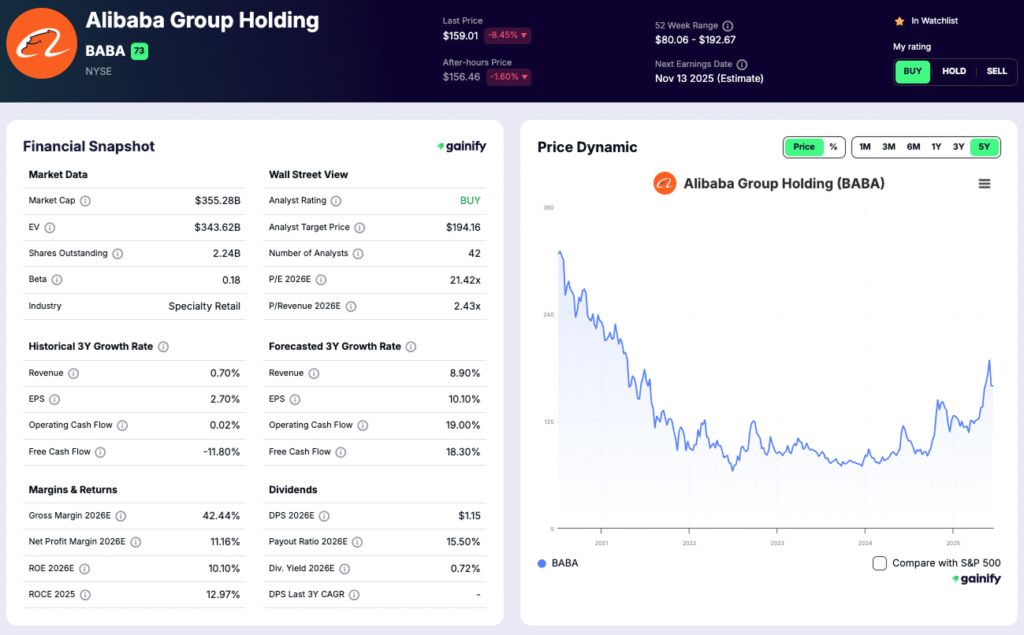
1. Alibaba Group Holding (NYSE:BABA)
- Market Cap: $355.28B
- Industry: Specialty Retail
- Last Price: $159.01
- Wall Street Target: $194.16
- Upside Potential: +22.1%
Alibaba remains the top China stock for U.S. investors. Analysts believe Alibaba’s e-commerce dominance, cloud computing division, and AI initiatives will continue to drive steady growth. Despite recent regulatory pressures, BABA is seen as a long-term recovery play with improving profitability.
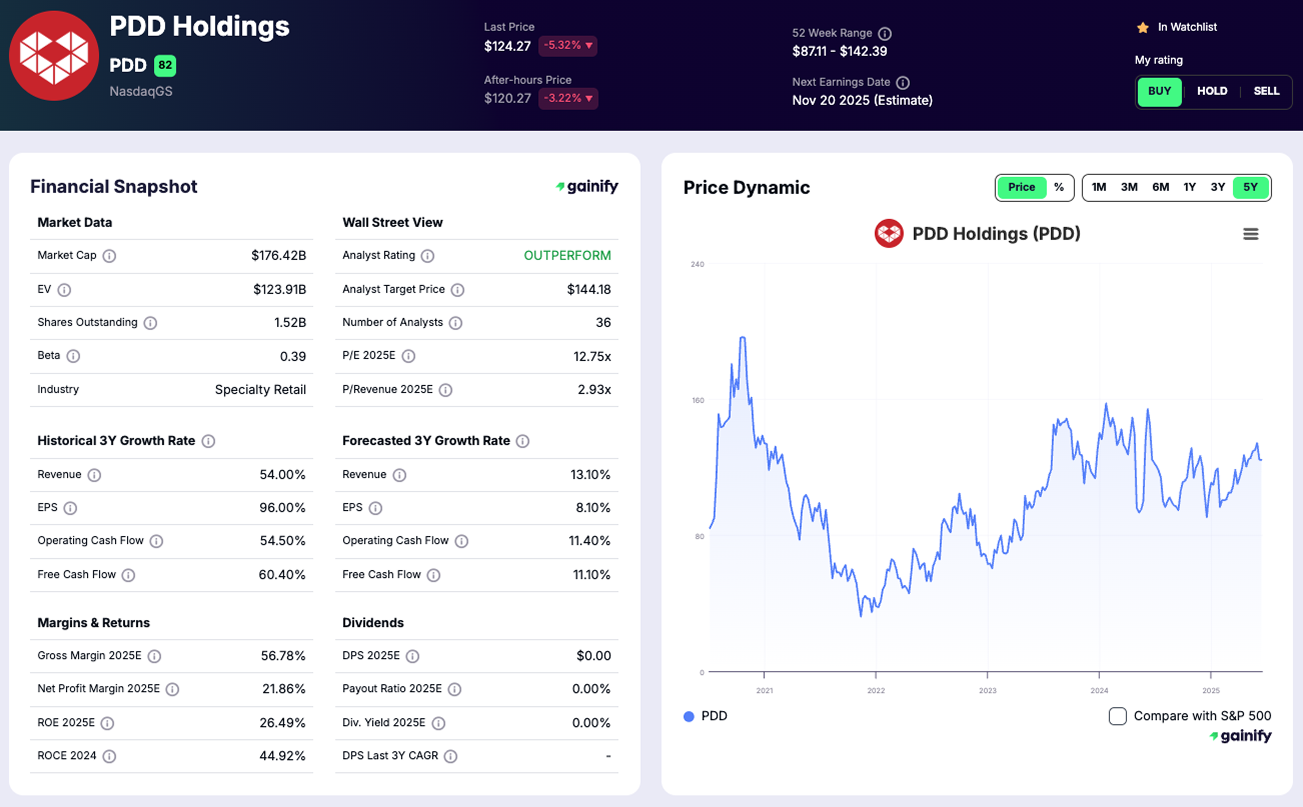
2. PDD Holdings (NASDAQ:PDD)
- Market Cap: $176.42B
- Industry: Specialty Retail
- Last Price: $124.27
- Wall Street Target: $144.18
- Upside Potential: +16.0%
PDD Holdings, the parent company of Pinduoduo and Temu, has become a major retail disruptor. Its low-cost strategy and global expansion are helping it outperform peers. Wall Street expects continued growth in international sales and digital retail innovation despite the tariff headwinds.
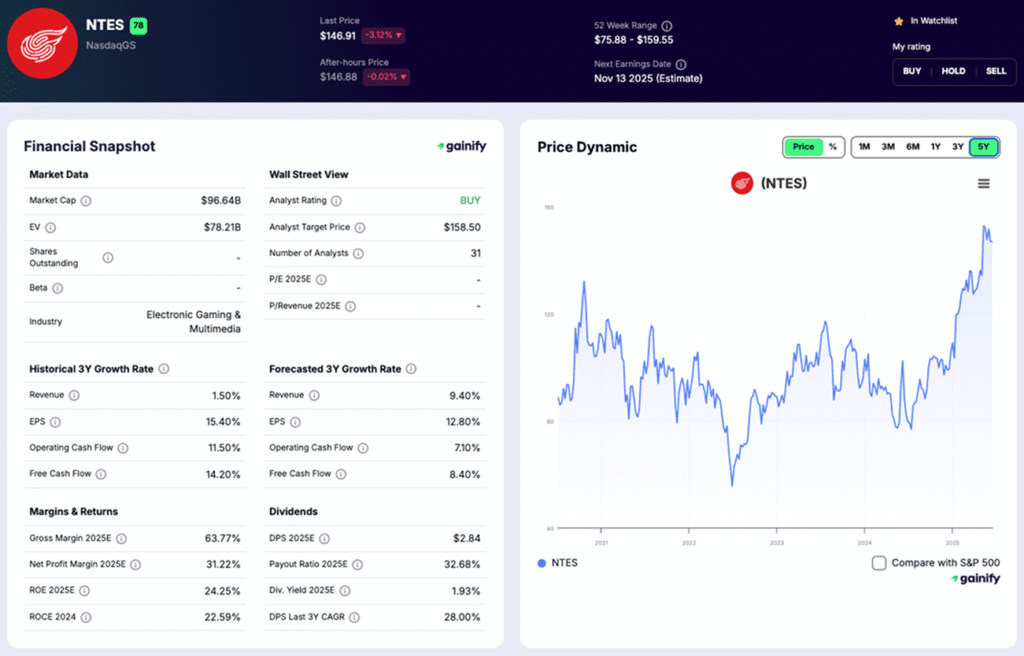
3. NetEase (NASDAQ:NTES)
- Market Cap: $96.64B
- Industry: Electronic Gaming & Multimedia
- Last Price: $146.91
- Wall Street Target: $158.50
- Upside Potential: +7.9%
NetEase is one of China’s leading gaming companies and a growing force in entertainment technology. The company’s strong cash flow, new game releases, and music streaming business are fueling moderate but steady upside potential.
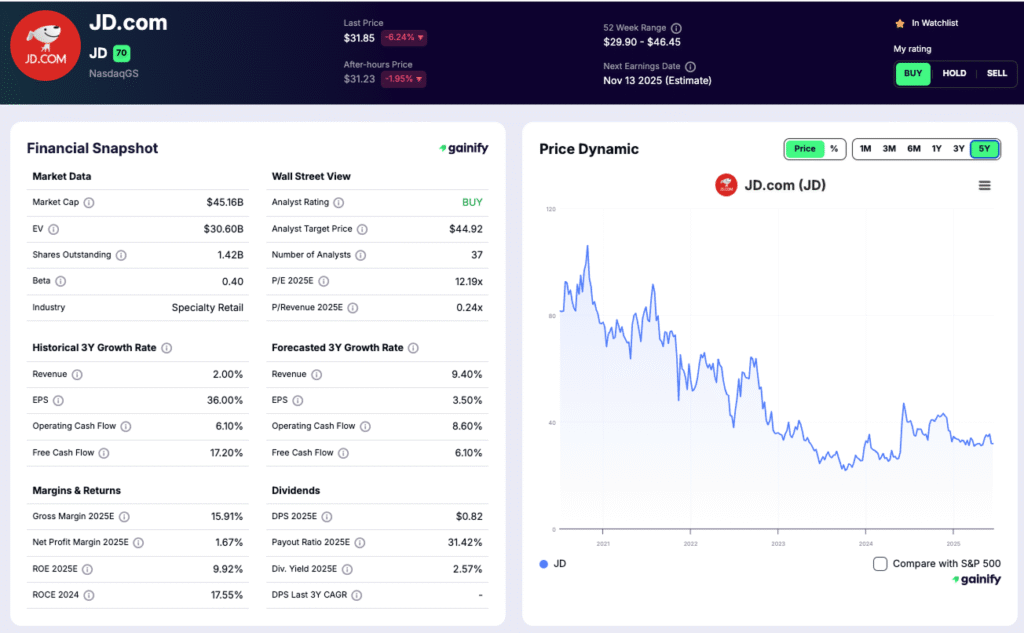
4. JD.com (NASDAQ:JD)
- Market Cap: $45.16B
- Industry: Specialty Retail
- Last Price: $31.85
- Wall Street Target: $44.92
- Upside Potential: +41.0%
JD.com is China’s largest direct retailer and one of the strongest logistics networks in the world. Analysts see JD as deeply undervalued, with room for growth in AI logistics, automation, and international e-commerce expansion. This is one of the top rebound candidates among China stocks.
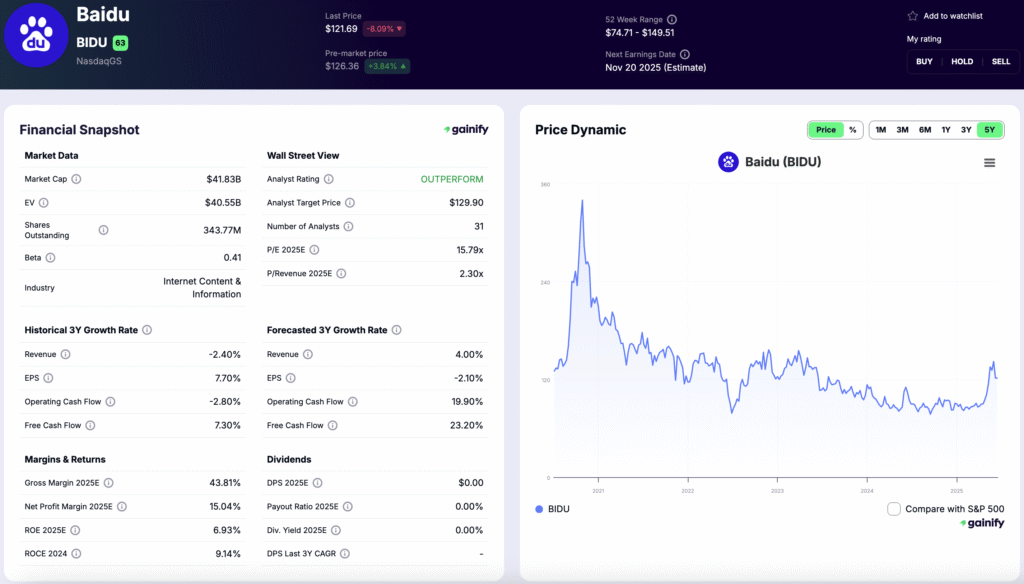
5. Baidu (NASDAQ:BIDU)
- Market Cap: $41.83B
- Industry: Internet Content & Information
- Last Price: $121.69
- Wall Street Target: $129.90
- Upside Potential: +6.8%
Baidu, often called the “Google of China”, has transformed into an AI and autonomous driving leader. While its core search business remains stable, Wall Street expects Baidu’s generative AI products and smart transportation ventures to boost earnings in the coming quarters.
6. Tencent Music Entertainment Group (NYSE:TME)
- Market Cap: $35.49B
- Industry: Internet Content & Information
- Last Price: $22.43
- Wall Street Target: $28.32
- Upside Potential: +26.3%
Tencent Music runs China’s top music platforms such as QQ Music and Kugou. Analysts project stronger monetization from paid subscriptions and live-streaming services, with improving margins and user engagement.
7. Li Auto (NASDAQ:LI)
- Market Cap: $23.01B
- Industry: Auto Manufacturers
- Last Price: $22.80
- Wall Street Target: $28.88
- Upside Potential: +26.7%
Li Auto continues to stand out among China’s electric vehicle stocks. Its focus on extended-range EVs and premium smart vehicles has earned it strong investor attention. Wall Street expects rising deliveries and a solid path toward profitability.
8. Futu Holdings (NASDAQ:FUTU)
- Market Cap: $21.52B
- Industry: Financial Services
- Last Price: $154.60
- Wall Street Target: $205.33
- Upside Potential: +32.8%
Futu Holdings operates the popular trading platform Moomoo. With the rapid digitalization of finance in Asia, Futu is expanding its user base and increasing assets under management. Wall Street analysts view FUTU as a high-growth fintech stock with strong global potential.
9. KE Holdings (NYSE:BEKE)
- Market Cap: $20.77B
- Industry: Real Estate Services
- Last Price: $17.65
- Wall Street Target: $22.87
- Upside Potential: +29.5%
Also known as Beike, KE Holdings is China’s largest online property platform. Analysts expect recovery as the Chinese real estate market stabilizes, supported by government stimulus measures and housing reforms.
10. XPeng (NYSE:XPEV)
- Market Cap: $20.05B
- Industry: Auto Manufacturers
- Last Price: $21.02
- Wall Street Target: $26.48
- Upside Potential: +26.0%
XPeng competes directly with Tesla and NIO. Wall Street forecasts strong gains from its new SUV models, improved autonomous driving software, and potential overseas expansion.
11. NIO (NYSE:NIO)
- Market Cap: $16.60B
- Industry: Auto Manufacturers
- Last Price: $6.71
- Wall Street Target: $6.79
- Upside Potential: +1.2%
NIO remains one of the most recognized electric vehicle brands from China. While short-term performance is weak, analysts expect gradual recovery as NIO launches new models and scales its battery-swap network globally.
Top China Stocks With the Highest Upside Potential according to Wall Street
Rank | Company | Ticker | Upside Potential |
1 | JD.com | JD | +41.0% |
2 | Futu Holdings | FUTU | +32.8% |
3 | KE Holdings | BEKE | +29.5% |
4 | Li Auto | LI | +26.7% |
5 | Tencent Music | TME | +26.3% |
4 Key Takeaways on China Stocks (October 2025)
- China stocks have underperformed sharply over the past five years.
The MSCI China Index has lagged the S&P 500 by more than 100 percentage points since 2020. Valuations for many leading Chinese companies now sit near multi-year lows, offering potential entry points for long-term investors. - Wall Street is turning selectively bullish.
Analysts are focusing on names with solid balance sheets and improving earnings visibility. JD.com, Futu Holdings, and Li Auto are among the top picks with the strongest upside potential based on Wall Street targets. - Growth leadership is shifting across sectors.
While e-commerce giants like Alibaba and PDD remain dominant, investors are increasingly drawn to emerging growth areas such as electric vehicles, fintech, and online entertainment. Li Auto, XPeng, and NetEase are seen as key innovation plays. - Risks remain, but sentiment is improving.
Regulatory uncertainty, slower consumer demand, and U.S.-China trade tensions continue to weigh on the outlook. However, policy support for technology and green energy, along with attractive valuations, is helping restore cautious optimism among institutional investors.